
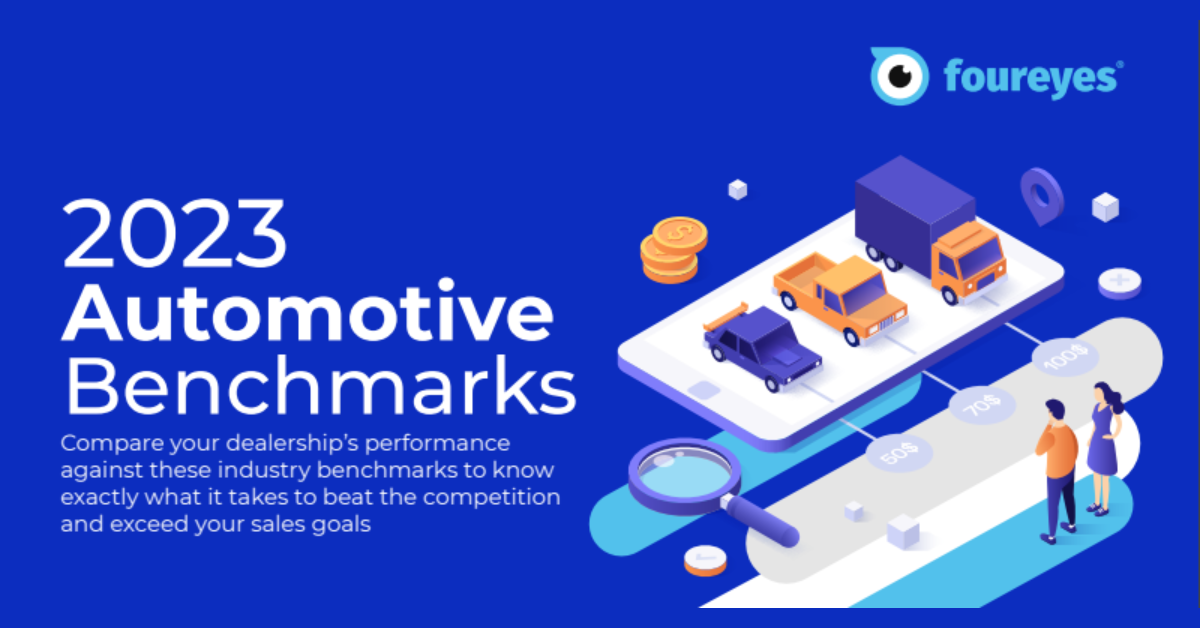
2022 Automotive Dealer Benchmarks Report
As automotive dealerships continue to adjust their strategies, tactics, and other process operations during this ongoing vehicle inventory shortage, we at Foureyes are sharing – for the fourth consecutive year – new auto industry benchmarks intended to help dealers understand the market, track trends in how leads behave, and drive sales success in 2022.


Background
This year, we analyzed Foureyes data from December 2020 - November 2021, which covers more than:
- 375 million dealer website visits
- 28 million unique pieces of inventory
- 21,500 automotive dealership websites (including group sites)
Foureyes tracks activity occurring on dealership websites, which was aggregated to provide the data in this report. To provide clear benchmarks, this report filters out website activity from bots, solicitors, job seekers, service customers, and other non-sales leads that dealers nationwide received. The insights below can be used to guide sales and marketing strategies and further boost your dealership’s competitive advantage.
Lead Experience
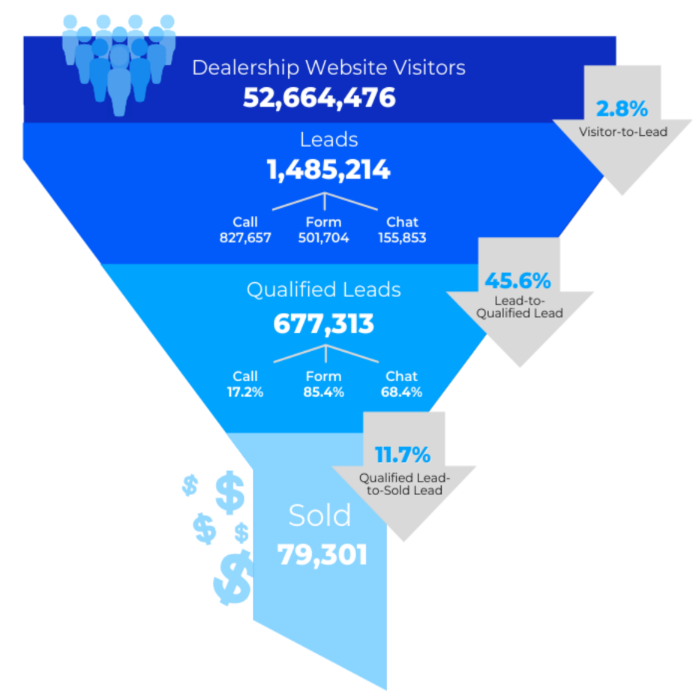
For this section, we’ve categorized the dealership web lead funnel stages as:
- Visitors to your website who may or may not have completed a lead action
- Leads who converted from a dealership’s website via phone call, form, or chat
- Qualified Leads who are confirmed to be in the market to purchase a vehicle, with service and other non-sales leads filtered out. These are a subset of the aforementioned “Leads”
- Sold Leads who originated from a dealer’s website and later completed the sales process and purchased a vehicle. These are a subset of “Qualified Leads”
Inventory shortage or not, there are leads dealers can’t sell to at any given point in time, and thus, essentially have to turn away. These leads ebb and flow seasonally or due to other market and economic conditions. What’s important for dealers to keep in mind is simply this: Don’t forget about them. Each lead remains a possible future sale.
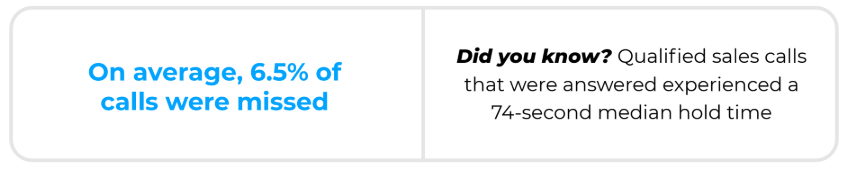
Altogether, 41.2% of the average dealership’s Qualified Leads are “mishandled,” meaning calls were missed, follow-up was delayed, or lead inquiries weren’t logged to the CRM.
Here’s the breakdown of each event that accounts for the 41.2% of Qualified Leads:
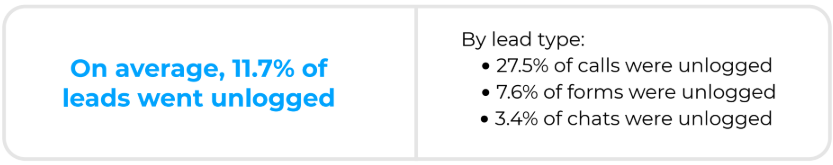

Consider this: the above data of “mishandled” leads essentially shows that dealer websites are capturing more leads than you’re accounting for, or even aware of. This can impact broader decision-making KPIs such as close rates.
Lead Engagement
Speaking of leads, do you know where yours are actually coming from? Making decisions on strategies, processes, tools, and overall budget is easier when backed by data.
For this section, we define “lead action” as when a lead calls, chats, or fills out a form via the dealership website.
Website Funnel Metrics
Returning Leads
On average, about half (51.9%) of the Qualified Leads that are active on dealers’ websites at any given time are returning visitors – i.e. they previously called, chatted, or filled out a form via the website.
By lead type:
- 40.9% of call Qualified Leads are returning visitors, while 59.1% are first-time visitors
- 54.1% of form Qualified Leads are returning, while 45.9% are new
- 50.0% of chat Qualified Leads are returning, while the other 50.0% are new
Days to Close
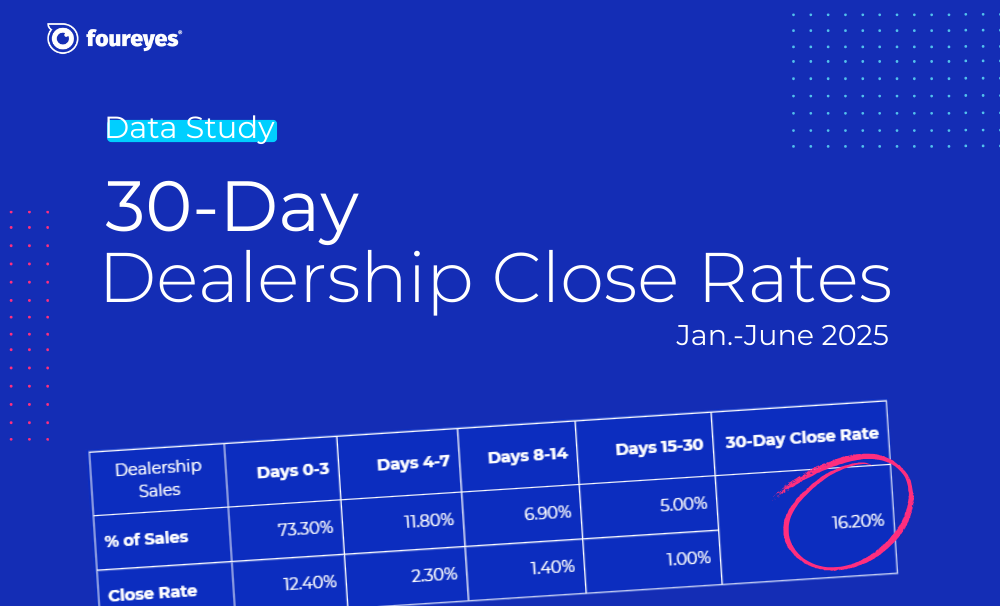
Among the Qualified Leads that buy, a majority (61%+) of them do so within three days of their first qualified lead action.
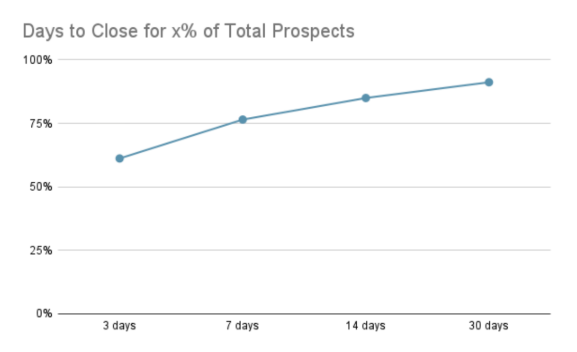
By lead type:
- 65.9% of Sold Leads from calls are closed within three days
- 60.3% of Sold Leads from form fills are closed within three days
- 58.1% of Sold Leads from chat are closed within three days
Vehicle Detail Page (VDP) Views
Leads tend to view more VDPs the further along they get in their sales cycle. Here’s a look at the average number of VDP views per stage:
- Leads: 4.2
- Qualified Leads: 7.7
- Sold Leads: 10.3
We can also look across the lead’s buying cycle to better understand how they view New vs Used VDPs:
Takeaway 1: More leads were likely to visit just a New or just a Used VDP than they were to visit both.
Takeaway 2: Not reflected above, however, there were slightly more “No VDP Views” at each stage of the funnel this past year (December 2020 - November 2021) compared to the year prior (December 2019 - November 2020). In other words, fewer people viewed VDPs this past year compared to the previous year. The biggest difference is observed at the Lead stage, which saw “No VDP Views” increase from 37.9% to 45.2%, while the smallest change is at the Visitor stage (57.6% vs 59.4%).
Lead Attribution
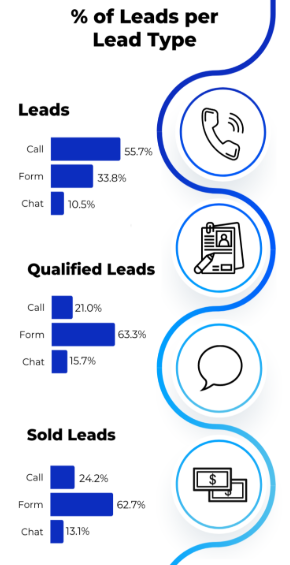
By Lead Type
This breakdown gives dealerships a much clearer picture of which lead actions are most valuable. For instance, at first glance, it appears phone calls seem to be your best lead source (55.7%). However, when you look at Qualified Leads (which filter out bots, wrong numbers, service inquiries and other non-sales leads) it’s actually form fills that account for the majority of Qualified Leads and Sold Leads.
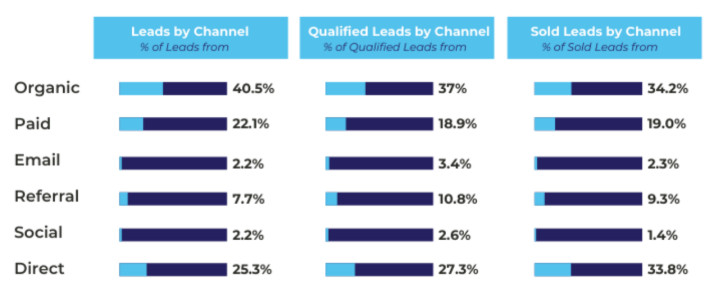
By Channel
Organic and paid advertising tend to draw in the majority of Leads. And while organic traffic remains the top-attributed channel for Qualified Leads and Sold Leads, there’s a decrease in Paid and an increase in Direct as the lead moves through the sales cycle.
Inventory Management
The inventory section of this report often uses the median to report on trends and key performance indicators for the automotive industry.
More specifically, dealership inventory data is reported primarily from one of two different points in time, including:
- December 2020: This represents the “peak” month of inventory for this report’s timeframe (December 2020 - November 2021). Meaning that since then, inventory levels steadily declined.
- November 2021: This is the last full month before data for the report was captured and analyzed, presenting the most current snapshot of inventory insights.
Throughout the rest of this section, the report looks at dealership inventory levels by brand, geography, condition, and price strategy.
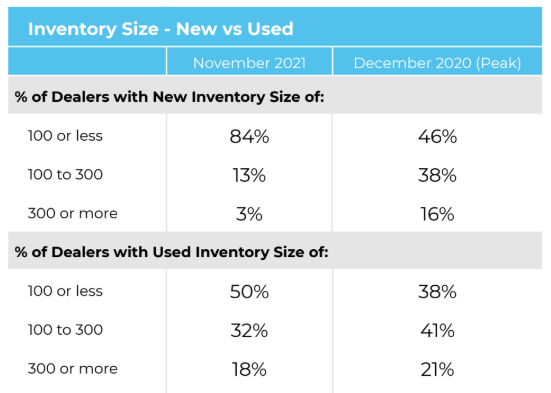
Inventory Size
Across all dealers, the median of new and used inventory on a dealer website, per each time period decreased.
New vehicle inventory at new franchise auto dealerships shrunk much more significantly over the past 12 months compared to used vehicle inventory.
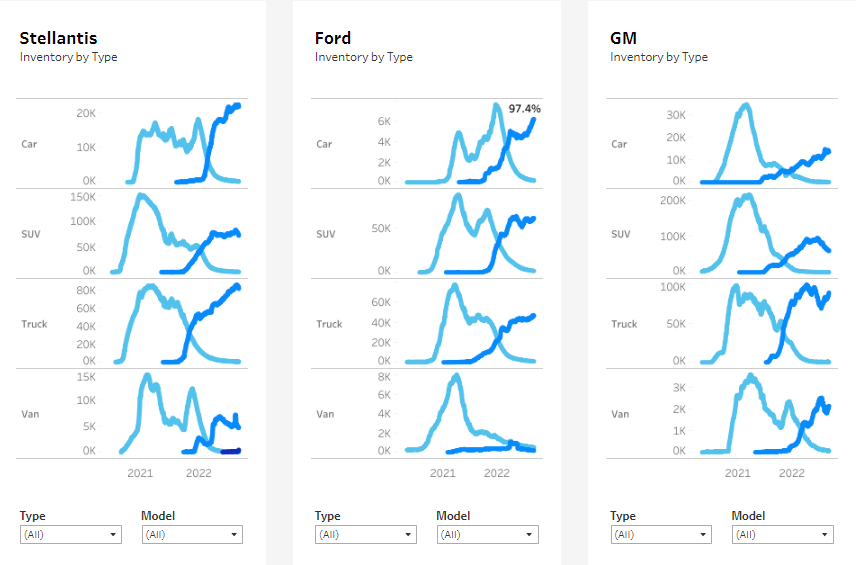
The median daily new inventory saw a decrease across all brands, but some more than others.
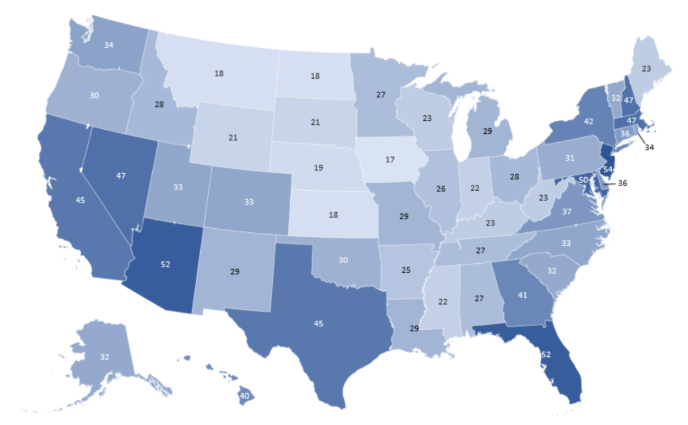
Inventory by State
Median New Vehicles Listed on a Dealer’s Website Each Month by State
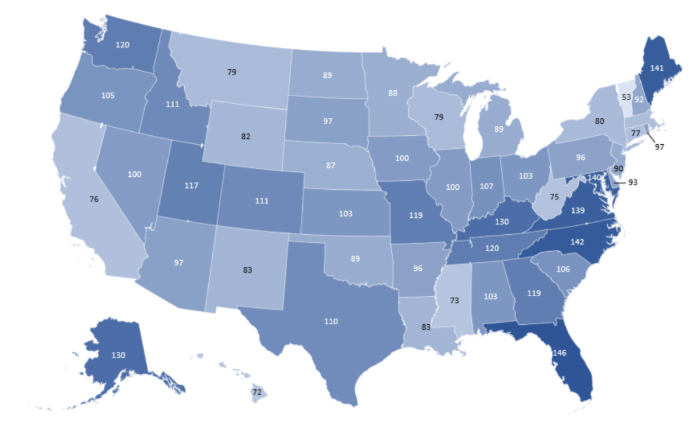
Median Used Vehicles Listed on a Dealer’s Website Each Month by State
Vehicles Added & Removed Across All Dealerships
The median number of vehicles that auto dealers added and removed from their online inventory in November 2021 includes 33 new vehicles and 68 used vehicles.
Dealership Price Adjustments
The median number of online price adjustments in November 2021 made by dealerships was 16 for new vehicles and 90 for used vehicles. Here’s what this data point looks like across different brands:
New Inventory Price Transparency
When it comes to price, only 22% of dealers list price or conditional price for all online new inventory. 49% list price for at least half of new inventory, while 30% don’t list price online for any inventory.
Conclusion
The 12 months of data presented in this report posed new, but also familiar trends and challenges for dealerships as it pertains to the effects of the inventory shortage.
Inventory will return, and when it does, you can give your dealership a competitive advantage by ensuring all your leads are automatically captured and nurtured.
Foureyes automatically tracks and captures website leads in the background for you, while also sending automated, personalized inventory emails to leads – leaving your sales team to do what they do best – sell.
Read More Blogs
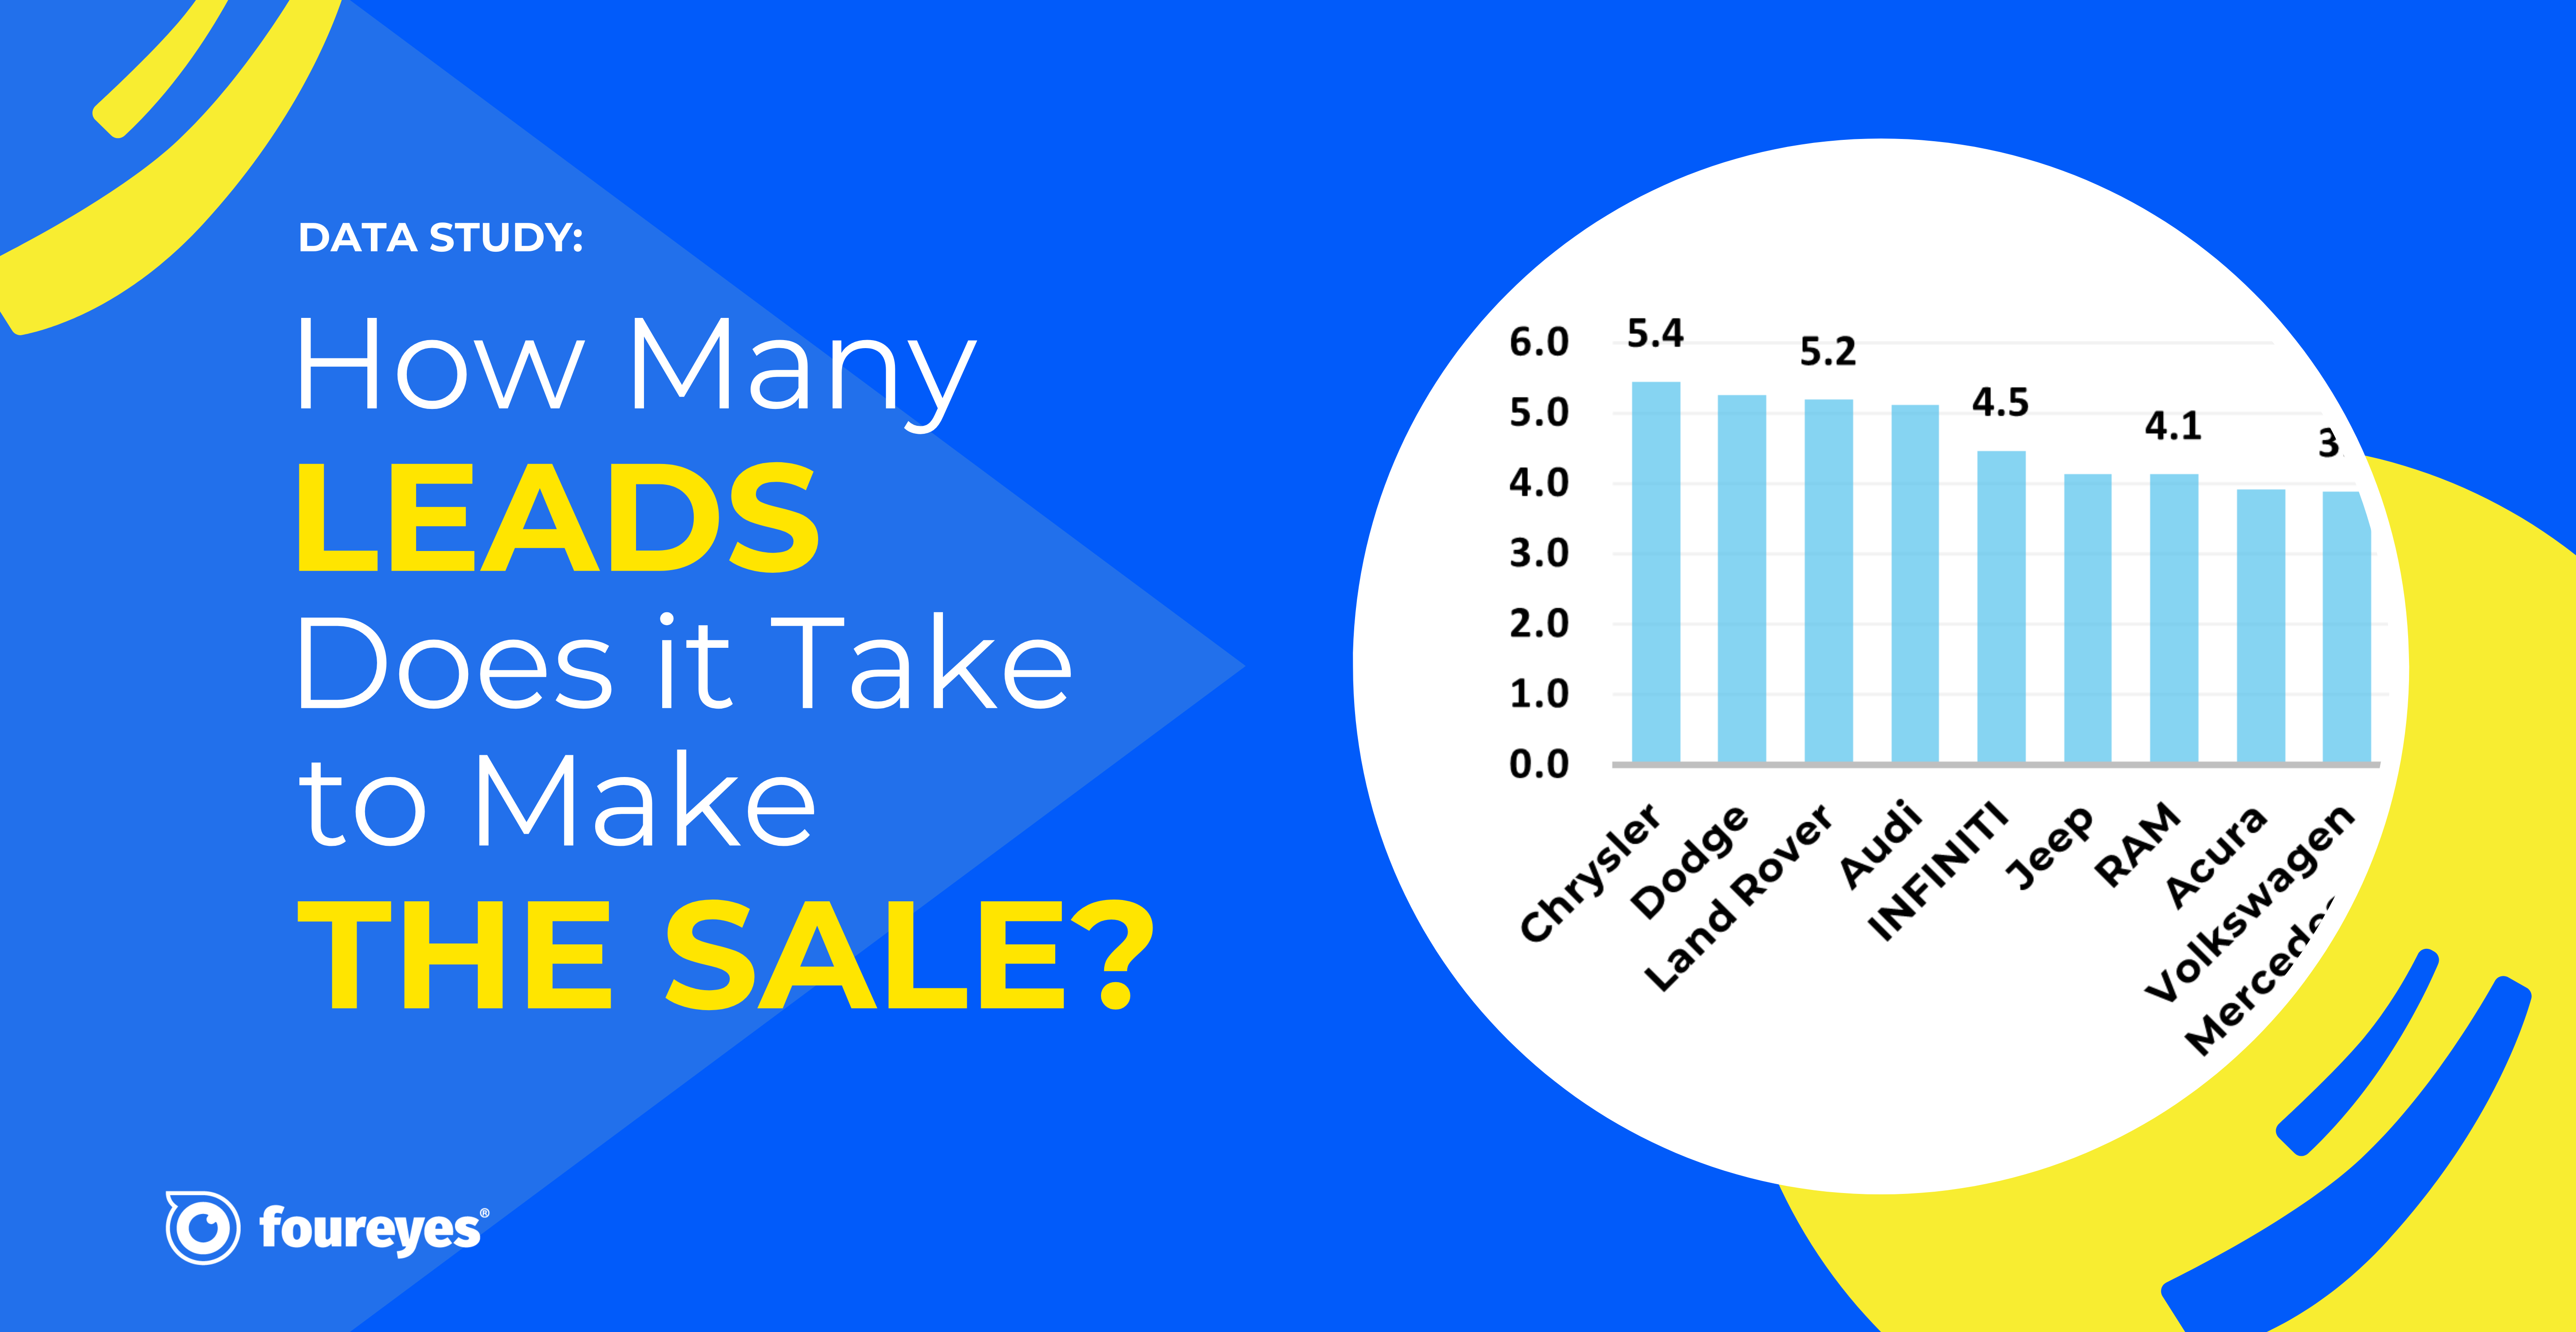
 Data Study: How Many Leads Does it Take to Sell a Car in 2026?
The average new vehicle takes 3.3 leads to sell. EVs and performance models take far more, work trucks and mainstream crossovers far less.

 Dealership Close Rates by Metro: And Why Contact Rates Matter
Foureyes tracked 2.6 million leads from more than 1,150 dealerships across 48 U.S. markets through Q1 2026 to dig deeper into dealership close rates by metropolitan area. One surprising finding: the correlation with contact rates.

 2026 Automotive Dealer Benchmarks Report
For the eighth year, Foureyes analyzed dealer website data to identify industry benchmarks, so you can compare your dealership’s performance and see what it takes to stay competitive.
 Data Warehousing for Auto Dealerships: What It Is, Why It's Hard, and Why Your CDP Makes or Breaks It
Data warehousing comes up constantly in dealer group conversations, but the actual mechanics rarely get explained clearly. This post tries to fix that. By the end you'll know what a warehouse actually does, why so many groups struggle to get it right, and why the data going in matters more than most people talk about.

 Foureyes Launches Snowflake Managed Services, Taking the Complexity Out of Data Warehouse Management for Dealer Groups
New offering gives dealer groups the warehousing expertise they need — without building and managing it themselves
.webp) Foureyes and Volie Announce New Integration Partnership to Boost BDC Performance
Foureyes and Volie Announce New Integration Partnership to Boost BDC PerformanceFoureyes and Volie announced a two-way integration partnership that connects audience-building and dealer data infrastructure with tools for dealership BDC teams.

 New Foureyes Consent Management Passes 100-Vendor Milestone, Signaling Industry Standardization Around Dealer-Controlled Consent
Foureyes today announced that more than 100 automotive retail vendors are now participating in Foureyes Consent Management, marking a major step toward standardizing how customer communication opt-out requests are managed across the industry.
.png) Introducing Foureyes Connect: A New Standard for Automotive Data
Introducing Foureyes Connect: A New Standard for Automotive DataFoureyes today announced the launch of Foureyes Connect, a different kind of data platform designed to reset how dealer groups operate and scale in an increasingly complex automotive retail landscape.
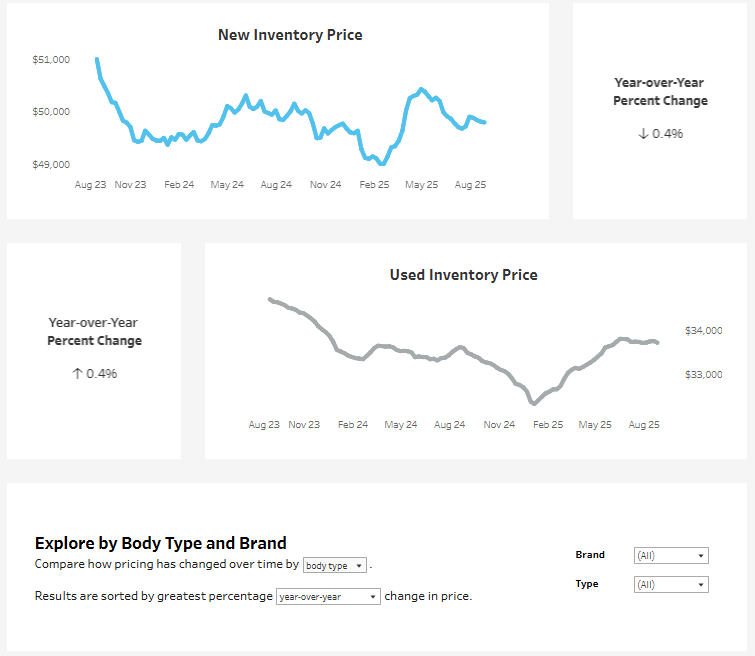 How to Use the U.S. Auto Prices Over Time Dashboard
Explore weekly U.S. auto pricing trends with Foureyes’ interactive dashboard. Compare new and used prices by brand and body type, track inflation and tariff impacts, and uncover insights to guide smarter decisions.
 How to Use the U.S. Automotive Inventory Over Time Dashboard
Track how U.S. auto inventory has changed since 2021 with this interactive dashboard. from Foureyes. Compare new vs. used, explore brand and model shifts, and gain insights to guide smarter pricing, stocking, and forecasting decisions on a weekly basis.
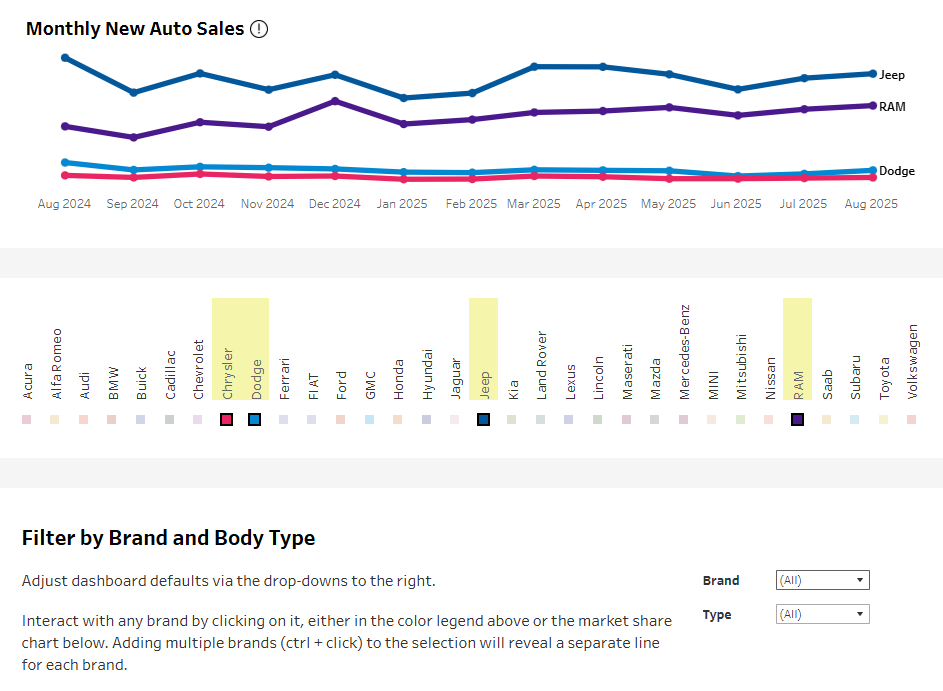 How to Use the U.S. Automotive New Vehicle Sales and Market Share Dashboard
Track monthly U.S. new vehicle sales and market share with this interactive dashboard from Foureyes. Compare brands, body types, and regions to uncover sales momentum, competitive shifts, and supply dynamics—updated monthly and available for free.
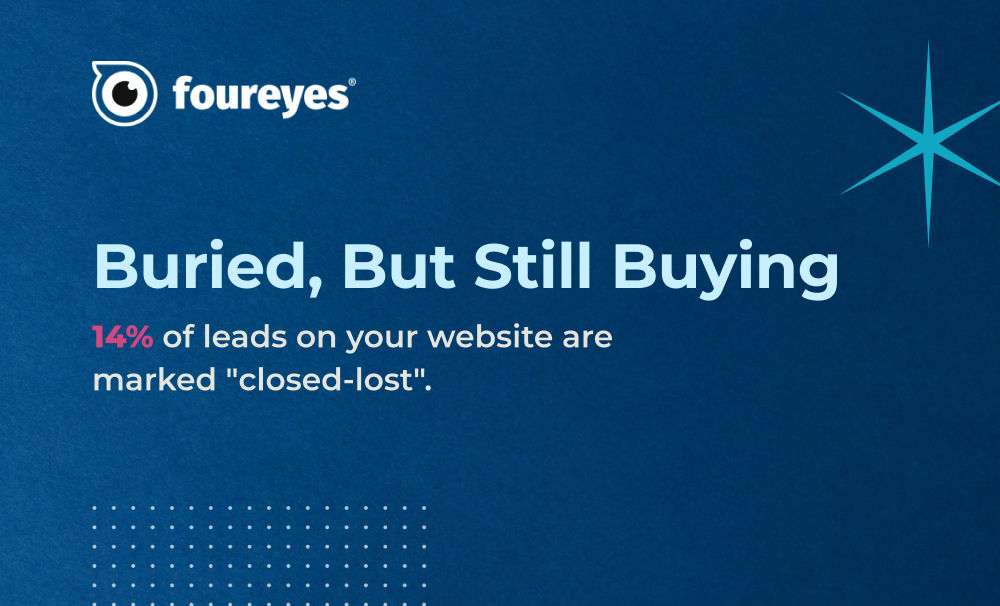 Data Study: The Leads You Marked as Lost Are Still Shopping
New Foureyes data shows why “closed-lost” doesn’t mean game over – and how dealers can win more with what they already have.
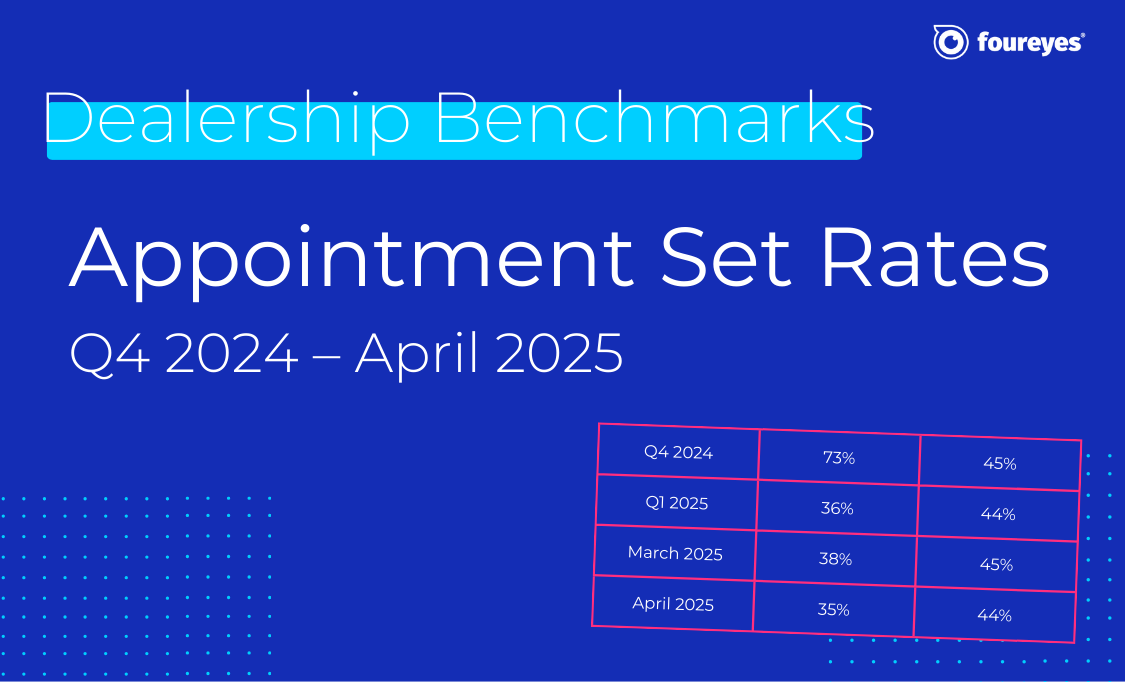 Automotive Sales Benchmarks: Appointment Set Rates for Q4 2024 to April 2025
If your dealership's appointment set rates feel like a mystery, you're not alone. But now, there's fresh data to show where you stand.
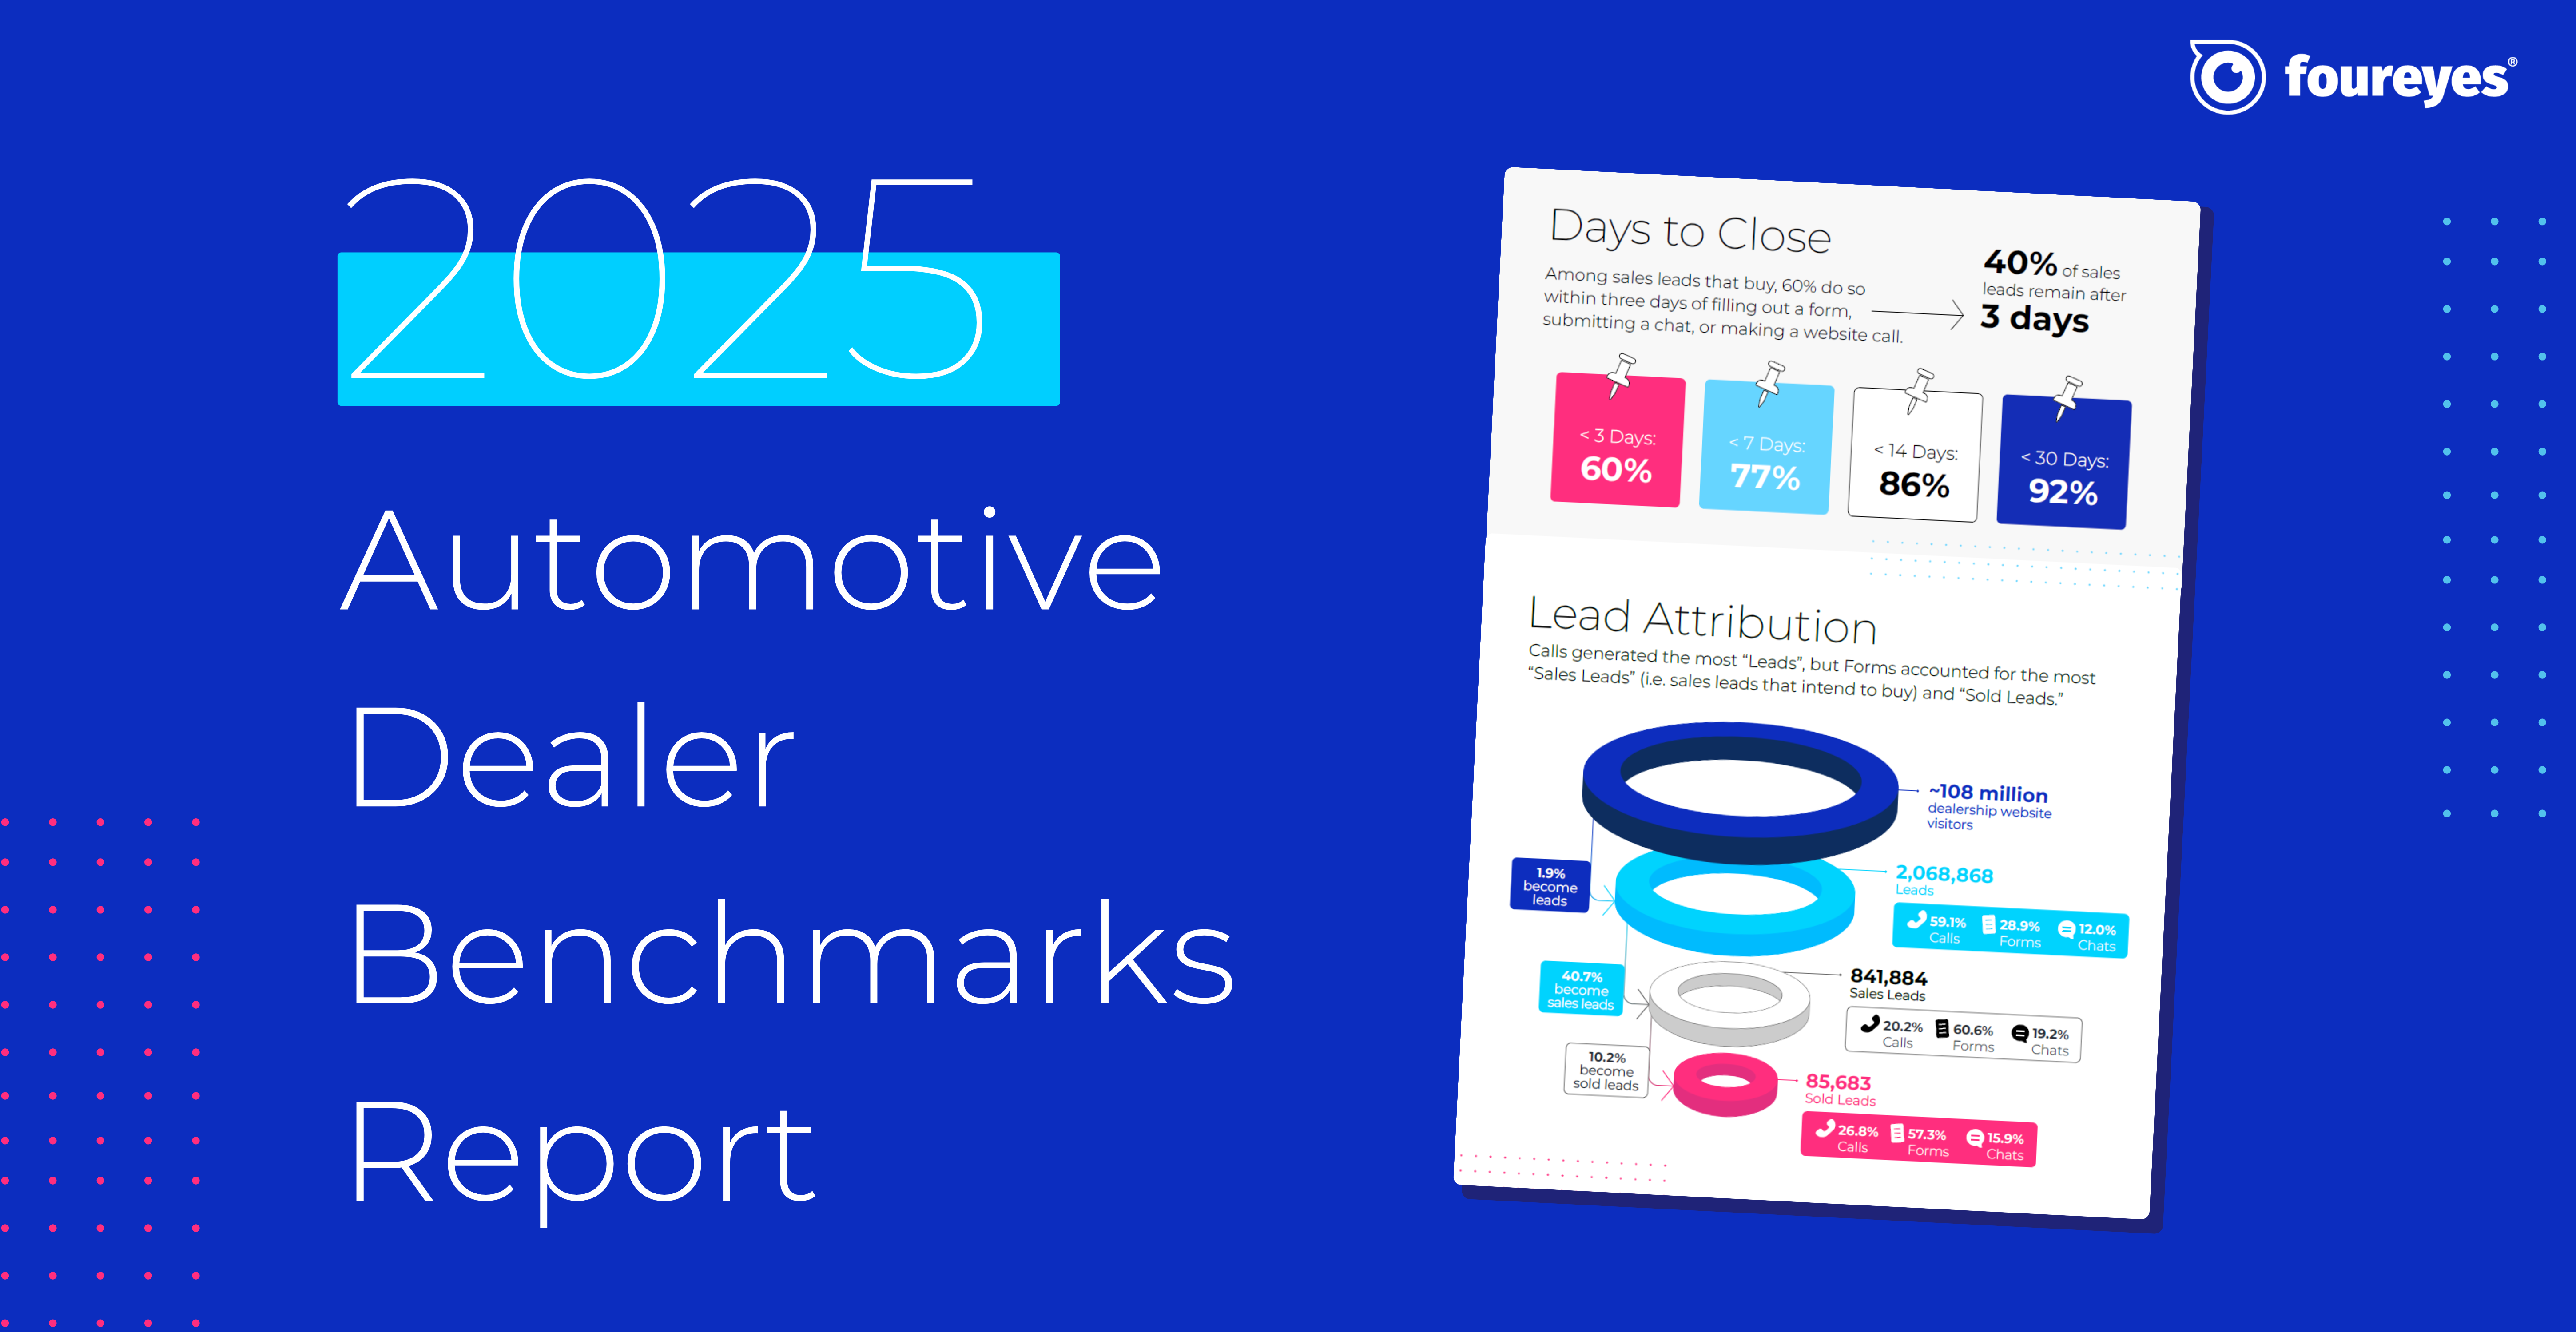 2025 Automotive Dealer Benchmarks Report
For the seventh straight year, Foureyes has dropped its Automotive Dealer Benchmark Report – pulling back the curtain on what's really happening with your leads throughout your sales process.
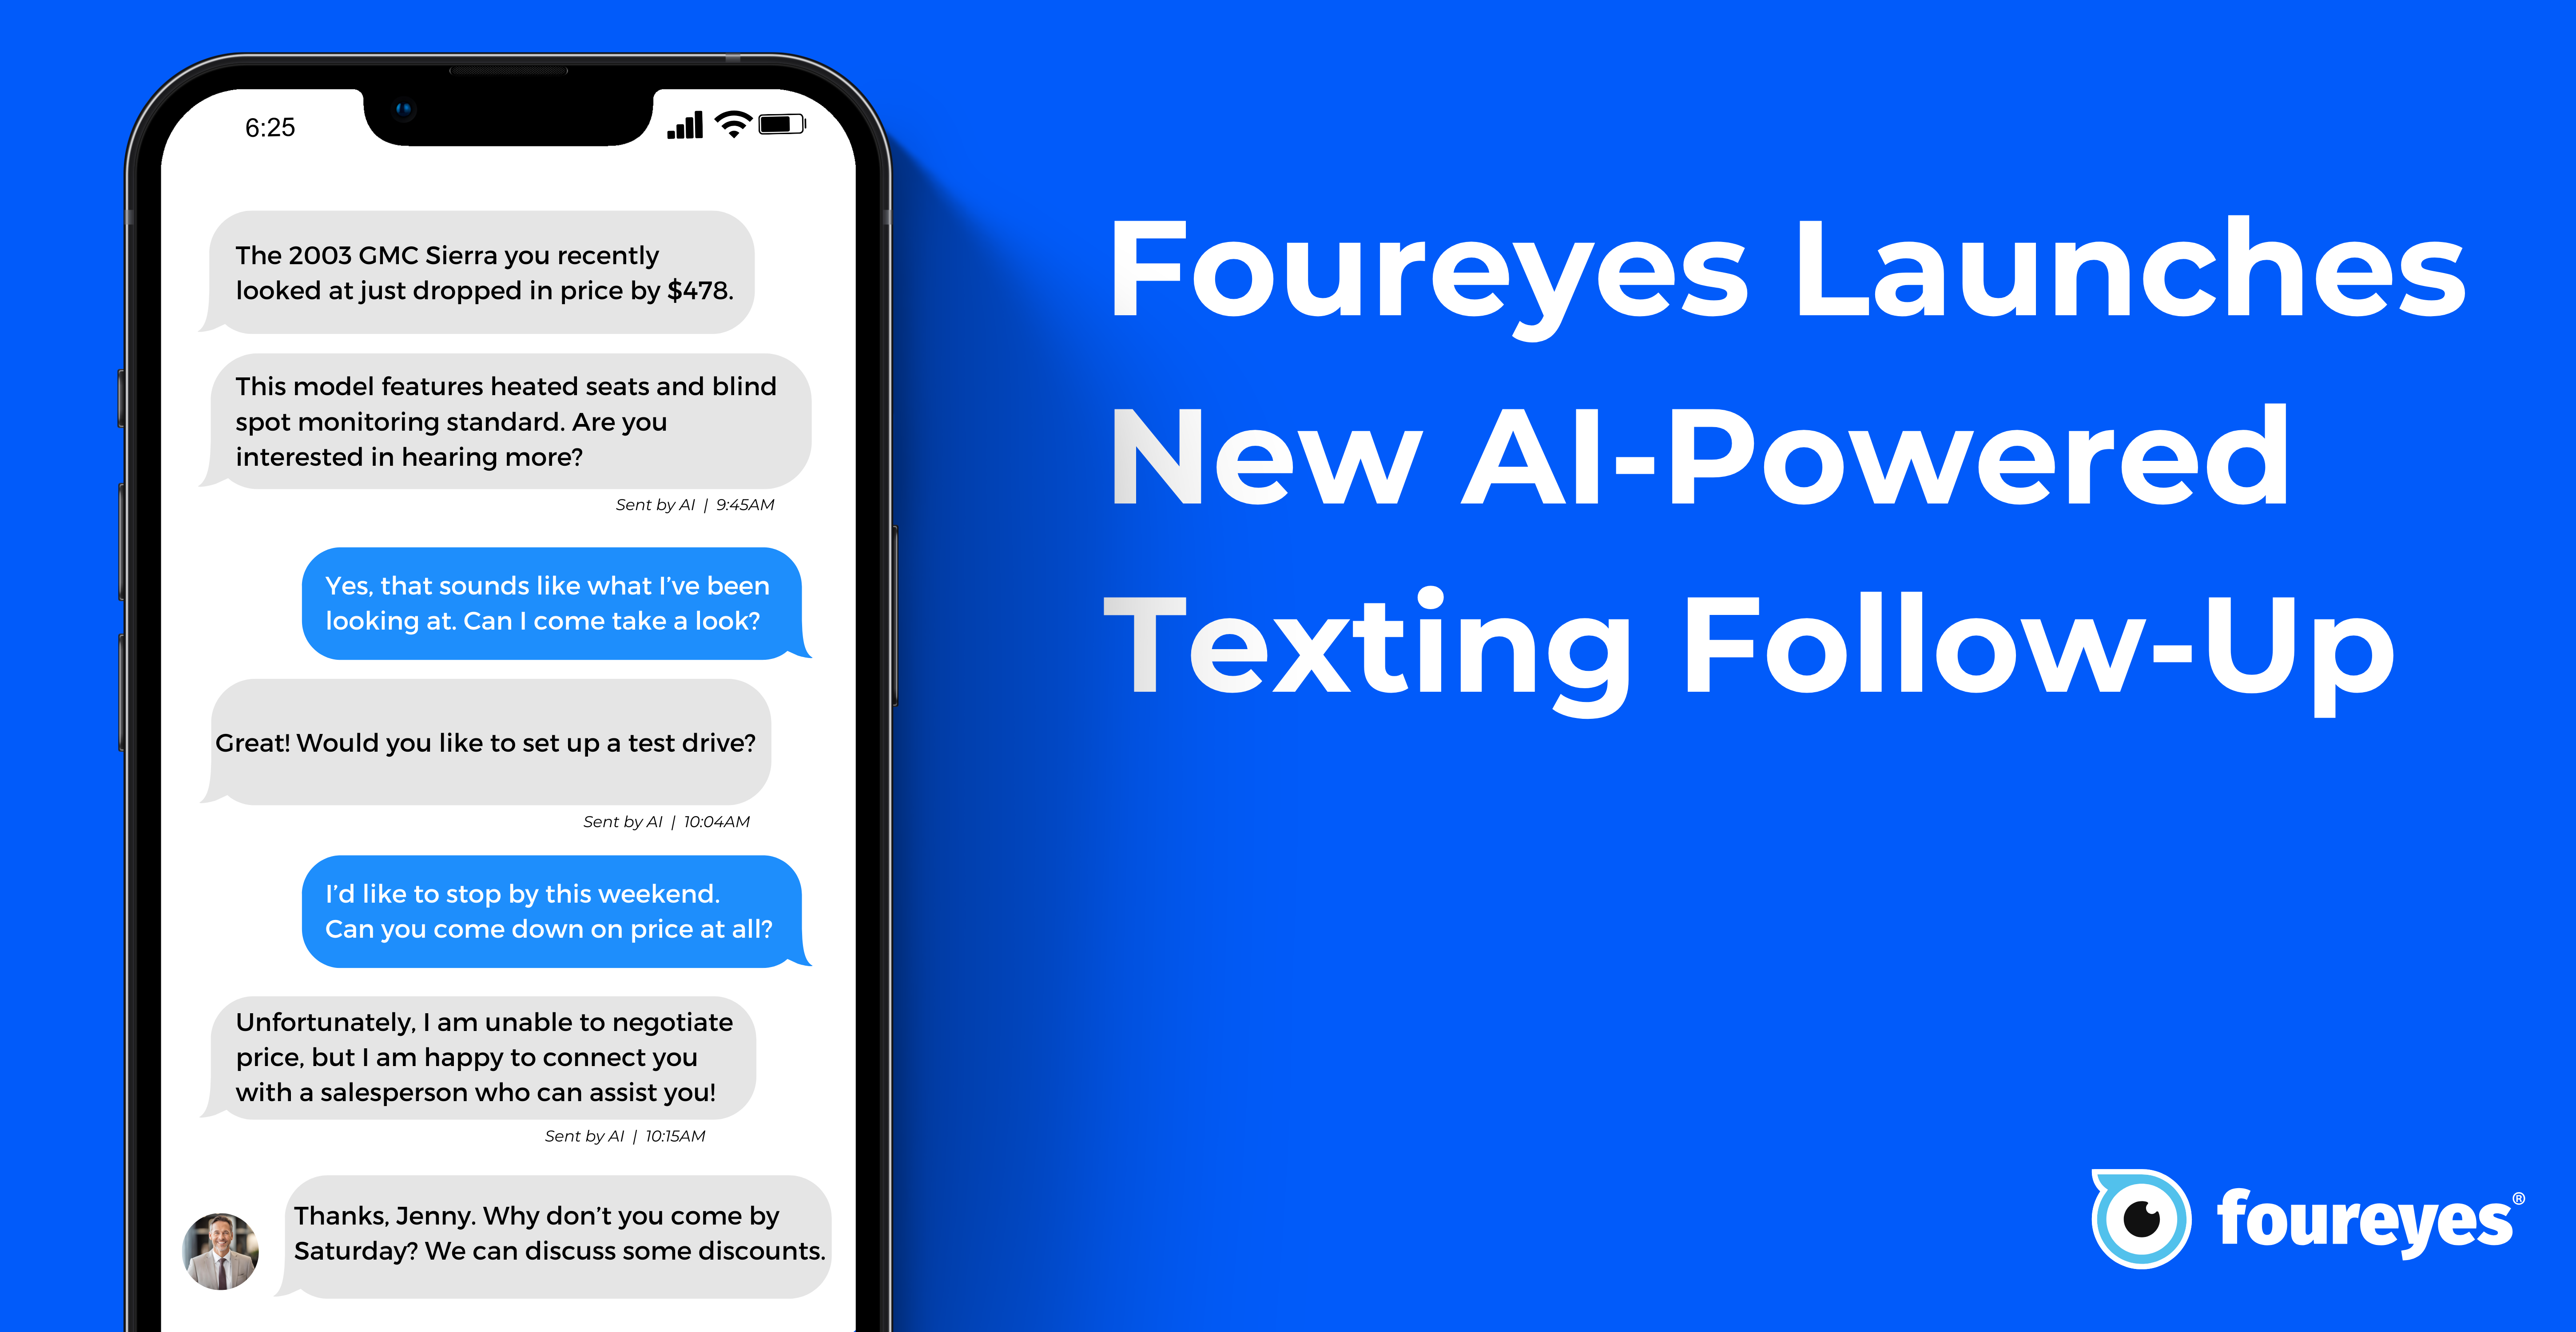 Foureyes Changing the Follow-up Game with Inventory-based Texting
See how the latest Foureyes innovation further helps dealerships match prospects to specific inventory.
 There are How Many “Hidden” Sales Leads at Automotive Dealerships?
New research of sales process data across U.S. automotive dealerships sheds light on the opportunity of “hidden” leads in dealership CRMs.
 How many leads do you actually need? And are you efficiently and effectively working them?
Which dials need to be turned, and how far, to ensure they are getting leads for inventory that actually need leads? And to ensure those leads efficiently and effectively worked?

 How Many Leads Does it Take for Dealerships to Sell a Car?
A Foureyes study of U.S. automotive dealerships identified the lead-to-sale “efficiency” across new vehicle inventory for Q1 2024.
 2024 Automotive Dealer Benchmarks Report
For the sixth consecutive year, Foureyes released its new automotive industry benchmarks. This data is intended to help dealers and dealer groups compare their performance against the industry and track trends in how leads behave.
.jpg)
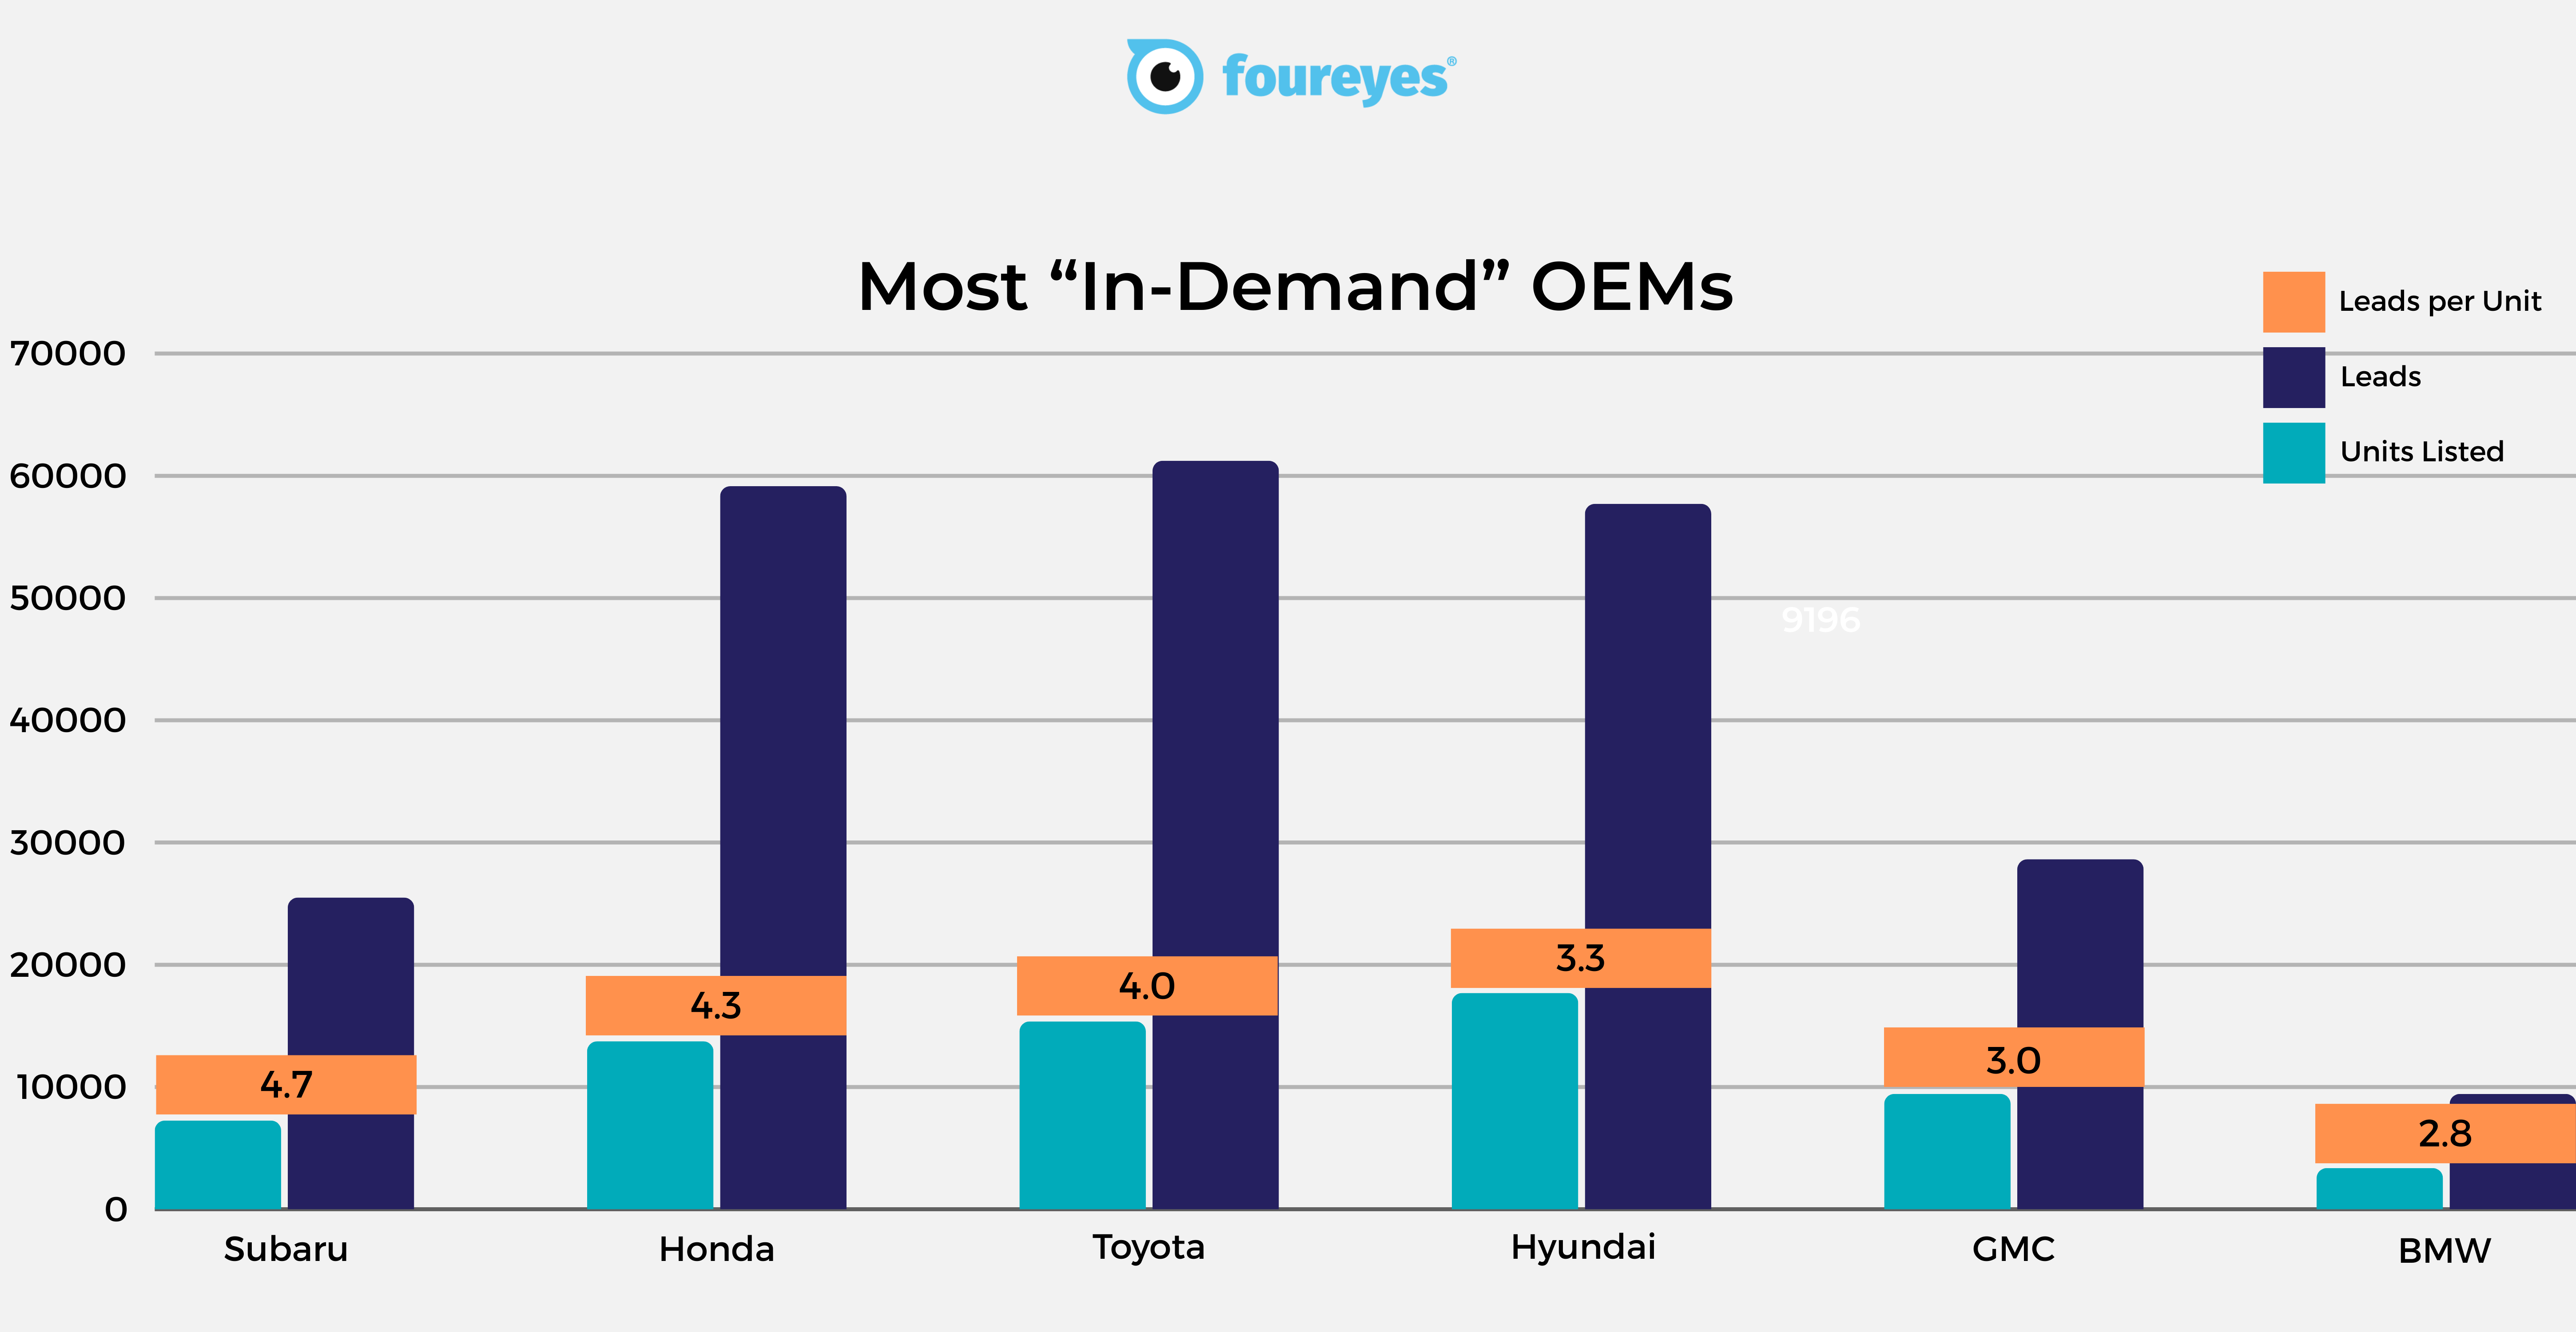 Most In-demand YMMs (2023 & 2024)
We dove into a pool of approximately 700 dealerships to scope out the most sought-after 2023 and 2024 YMMs and their OEMs over the past 3 months (min. 100 units per YMM)
.png)


 2022 Automotive Dealer Benchmarks Report
As automotive dealerships continue to adjust their strategies, tactics, and other process operations during this ongoing vehicle inventory shortage, we at Foureyes are sharing – for the fourth consecutive year – new auto industry benchmarks intended to help dealers understand the market, track trends in how leads behave, and drive sales success in 2022.

 2021 Automotive Dealer Benchmarks Report
For the third year in a row, we’re sharing auto industry benchmarks to help dealers and OEMs understand the market, track changes in customer behavior, and drive sales success in 2021.
 The 2020 Automotive Dealer Benchmarks Report
Start the new year off strong by reviewing your sales performance and creating 2020 goals. See how your dealership stacks up against the competition and use these auto industry benchmarks to develop a marketing and sales strategy for the new year.

