
Dealership Close Rates by Metro: And Why Contact Rates Matter
Foureyes tracked 2.6 million leads from more than 1,150 dealerships across 48 U.S. markets through Q1 2026 to dig deeper into dealership close rates by metropolitan area. One surprising finding: the correlation with contact rates.


Read More Blogs
 Data Ownership Sounds Simple. It Isn't.
Every automotive vendor will tell you that you own your data. It's practically a line item in the sales pitch at this point. But the details underneath the promise vary wildly from vendor to vendor. And it’s an issue that has led to almost $1 billion in legal settlements, just in automotive retail.

 Consent Management for Dealerships: 5 Questions to Ask Before You Buy
Once your dealership decides to take control of consent management, you want to select the right vendor that will meet your needs and make it easy.
 Data Study: How Many Leads Does it Take to Sell a Car in 2026?
The average new vehicle takes 3.3 leads to sell. EVs and performance models take far more, work trucks and mainstream crossovers far less.
 Dealership Close Rates by Metro: And Why Contact Rates Matter
Foureyes tracked 2.6 million leads from more than 1,150 dealerships across 48 U.S. markets through Q1 2026 to dig deeper into dealership close rates by metropolitan area. One surprising finding: the correlation with contact rates.
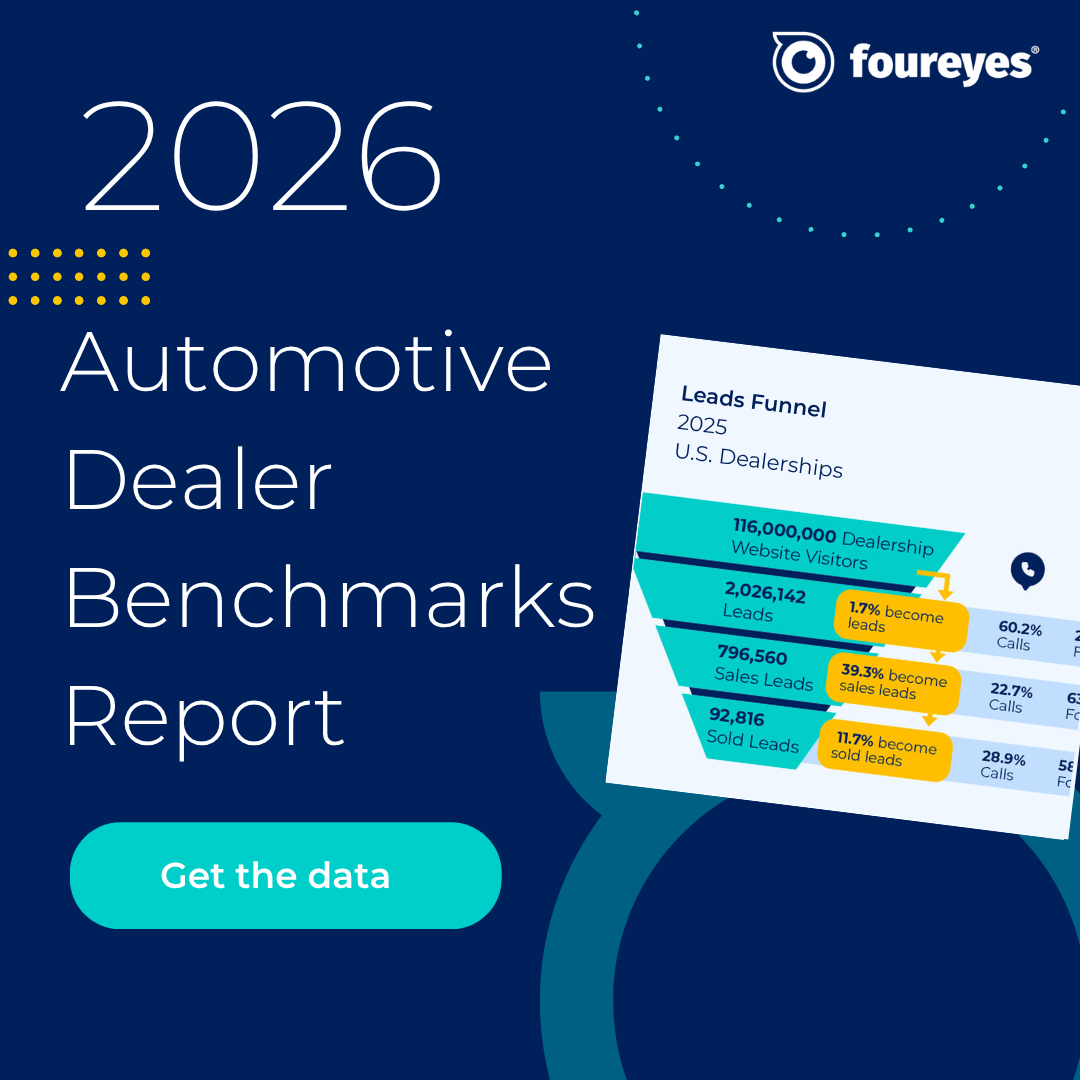 2026 Automotive Dealer Benchmarks Report
For the eighth year, Foureyes analyzed dealer website data to identify industry benchmarks, so you can compare your dealership’s performance and see what it takes to stay competitive.
 Data Warehousing for Auto Dealerships: What It Is, Why It's Hard, and Why Your CDP Makes or Breaks It
Data warehousing comes up constantly in dealer group conversations, but the actual mechanics rarely get explained clearly. This post tries to fix that. By the end you'll know what a warehouse actually does, why so many groups struggle to get it right, and why the data going in matters more than most people talk about.

 Foureyes Launches Snowflake Managed Services, Taking the Complexity Out of Data Warehouse Management for Dealer Groups
New offering gives dealer groups the warehousing expertise they need — without building and managing it themselves
.webp) Foureyes and Volie Announce New Integration Partnership to Boost BDC Performance
Foureyes and Volie Announce New Integration Partnership to Boost BDC PerformanceFoureyes and Volie announced a two-way integration partnership that connects audience-building and dealer data infrastructure with tools for dealership BDC teams.
 New Foureyes Consent Management Passes 100-Vendor Milestone, Signaling Industry Standardization Around Dealer-Controlled Consent
Foureyes today announced that more than 100 automotive retail vendors are now participating in Foureyes Consent Management, marking a major step toward standardizing how customer communication opt-out requests are managed across the industry.
.png) Introducing Foureyes Connect: A New Standard for Automotive Data
Introducing Foureyes Connect: A New Standard for Automotive DataFoureyes today announced the launch of Foureyes Connect, a different kind of data platform designed to reset how dealer groups operate and scale in an increasingly complex automotive retail landscape.
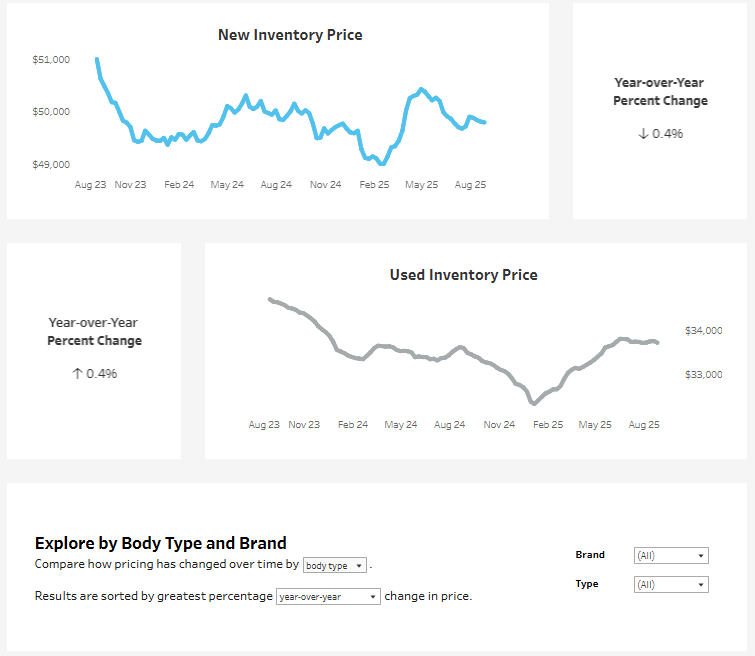 How to Use the U.S. Auto Prices Over Time Dashboard
Explore weekly U.S. auto pricing trends with Foureyes’ interactive dashboard. Compare new and used prices by brand and body type, track inflation and tariff impacts, and uncover insights to guide smarter decisions.
 How to Use the U.S. Automotive Inventory Over Time Dashboard
Track how U.S. auto inventory has changed since 2021 with this interactive dashboard. from Foureyes. Compare new vs. used, explore brand and model shifts, and gain insights to guide smarter pricing, stocking, and forecasting decisions on a weekly basis.
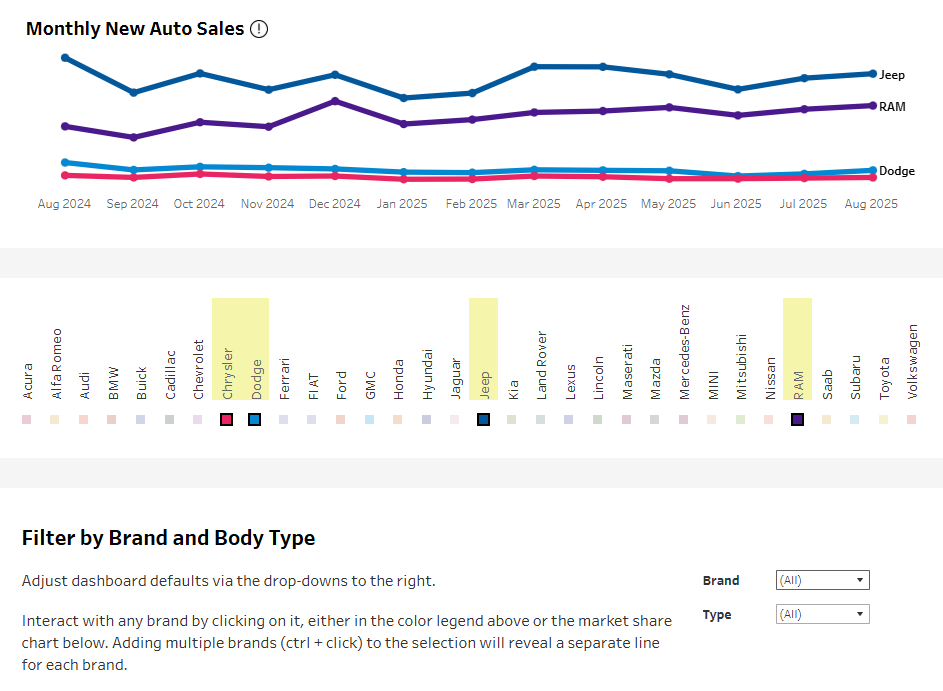 How to Use the U.S. Automotive New Vehicle Sales and Market Share Dashboard
Track monthly U.S. new vehicle sales and market share with this interactive dashboard from Foureyes. Compare brands, body types, and regions to uncover sales momentum, competitive shifts, and supply dynamics—updated monthly and available for free.
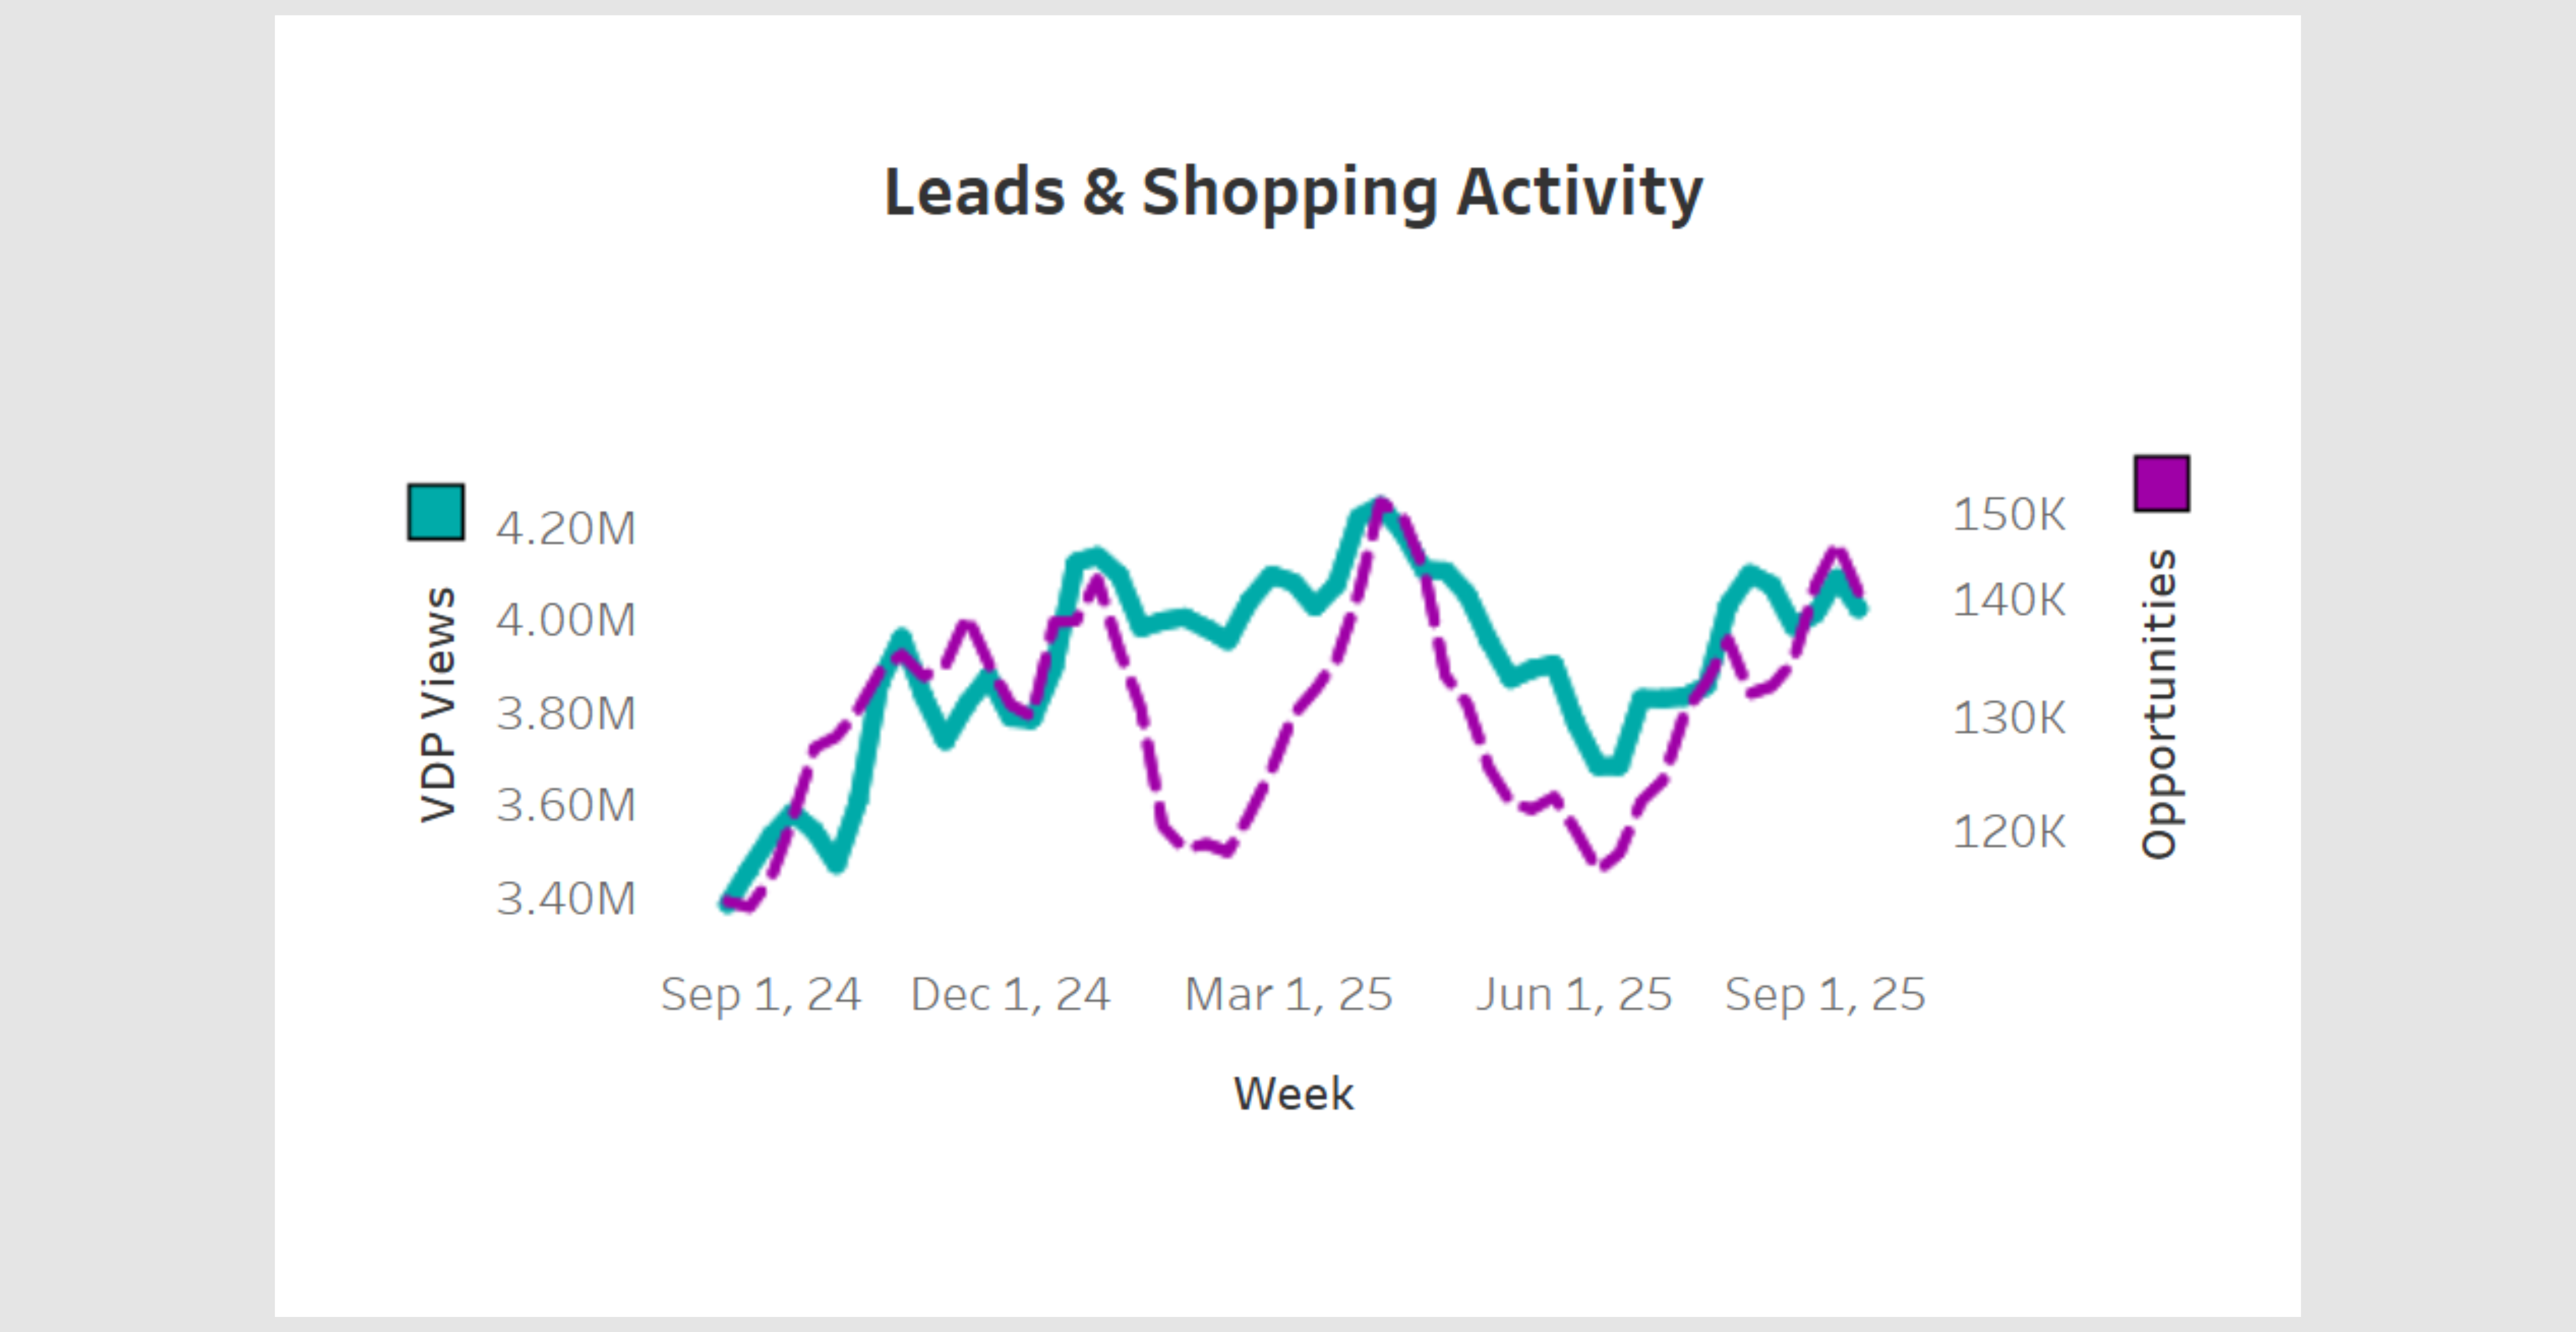
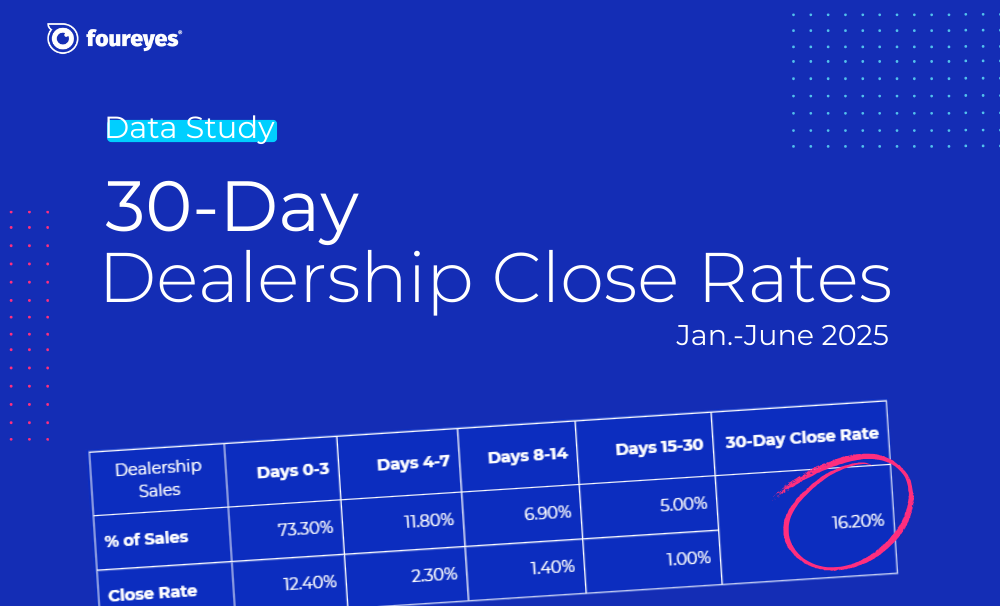
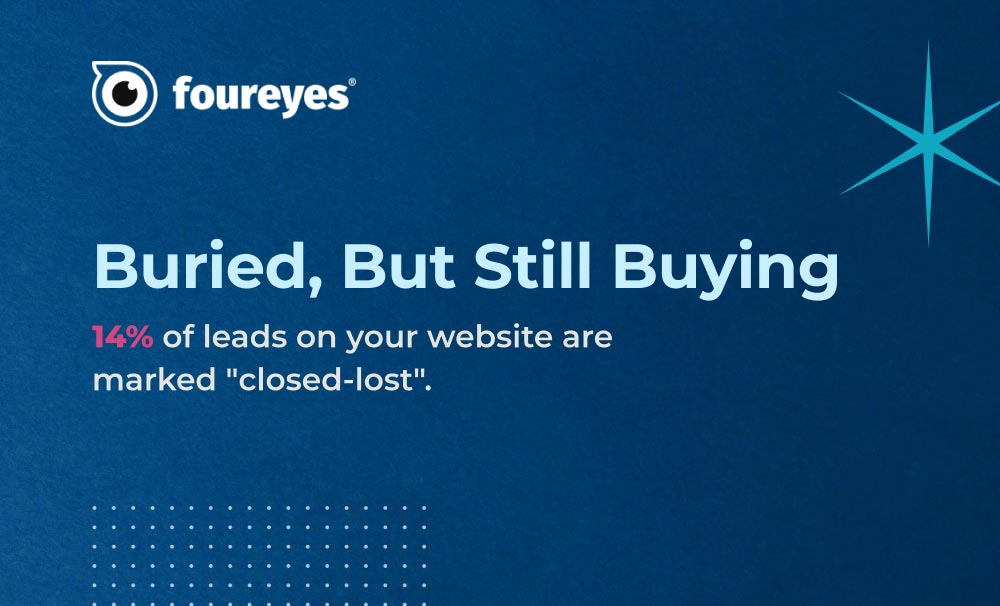 Data Study: The Leads You Marked as Lost Are Still Shopping
New Foureyes data shows why “closed-lost” doesn’t mean game over – and how dealers can win more with what they already have.
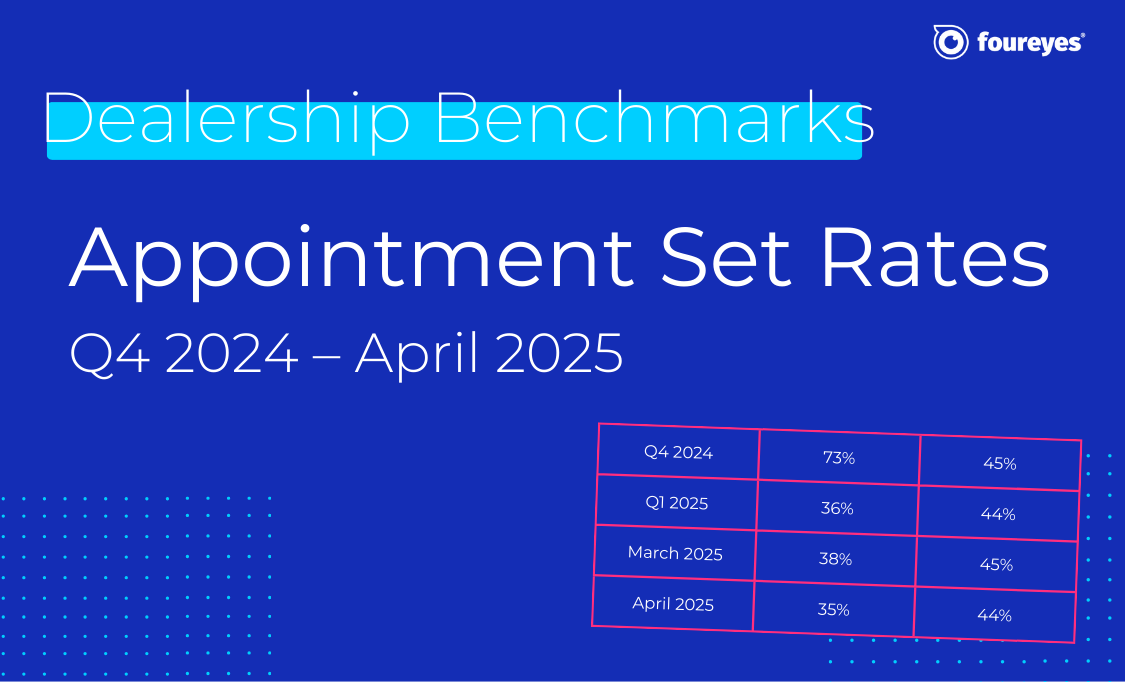 Automotive Sales Benchmarks: Appointment Set Rates for Q4 2024 to April 2025
If your dealership's appointment set rates feel like a mystery, you're not alone. But now, there's fresh data to show where you stand.
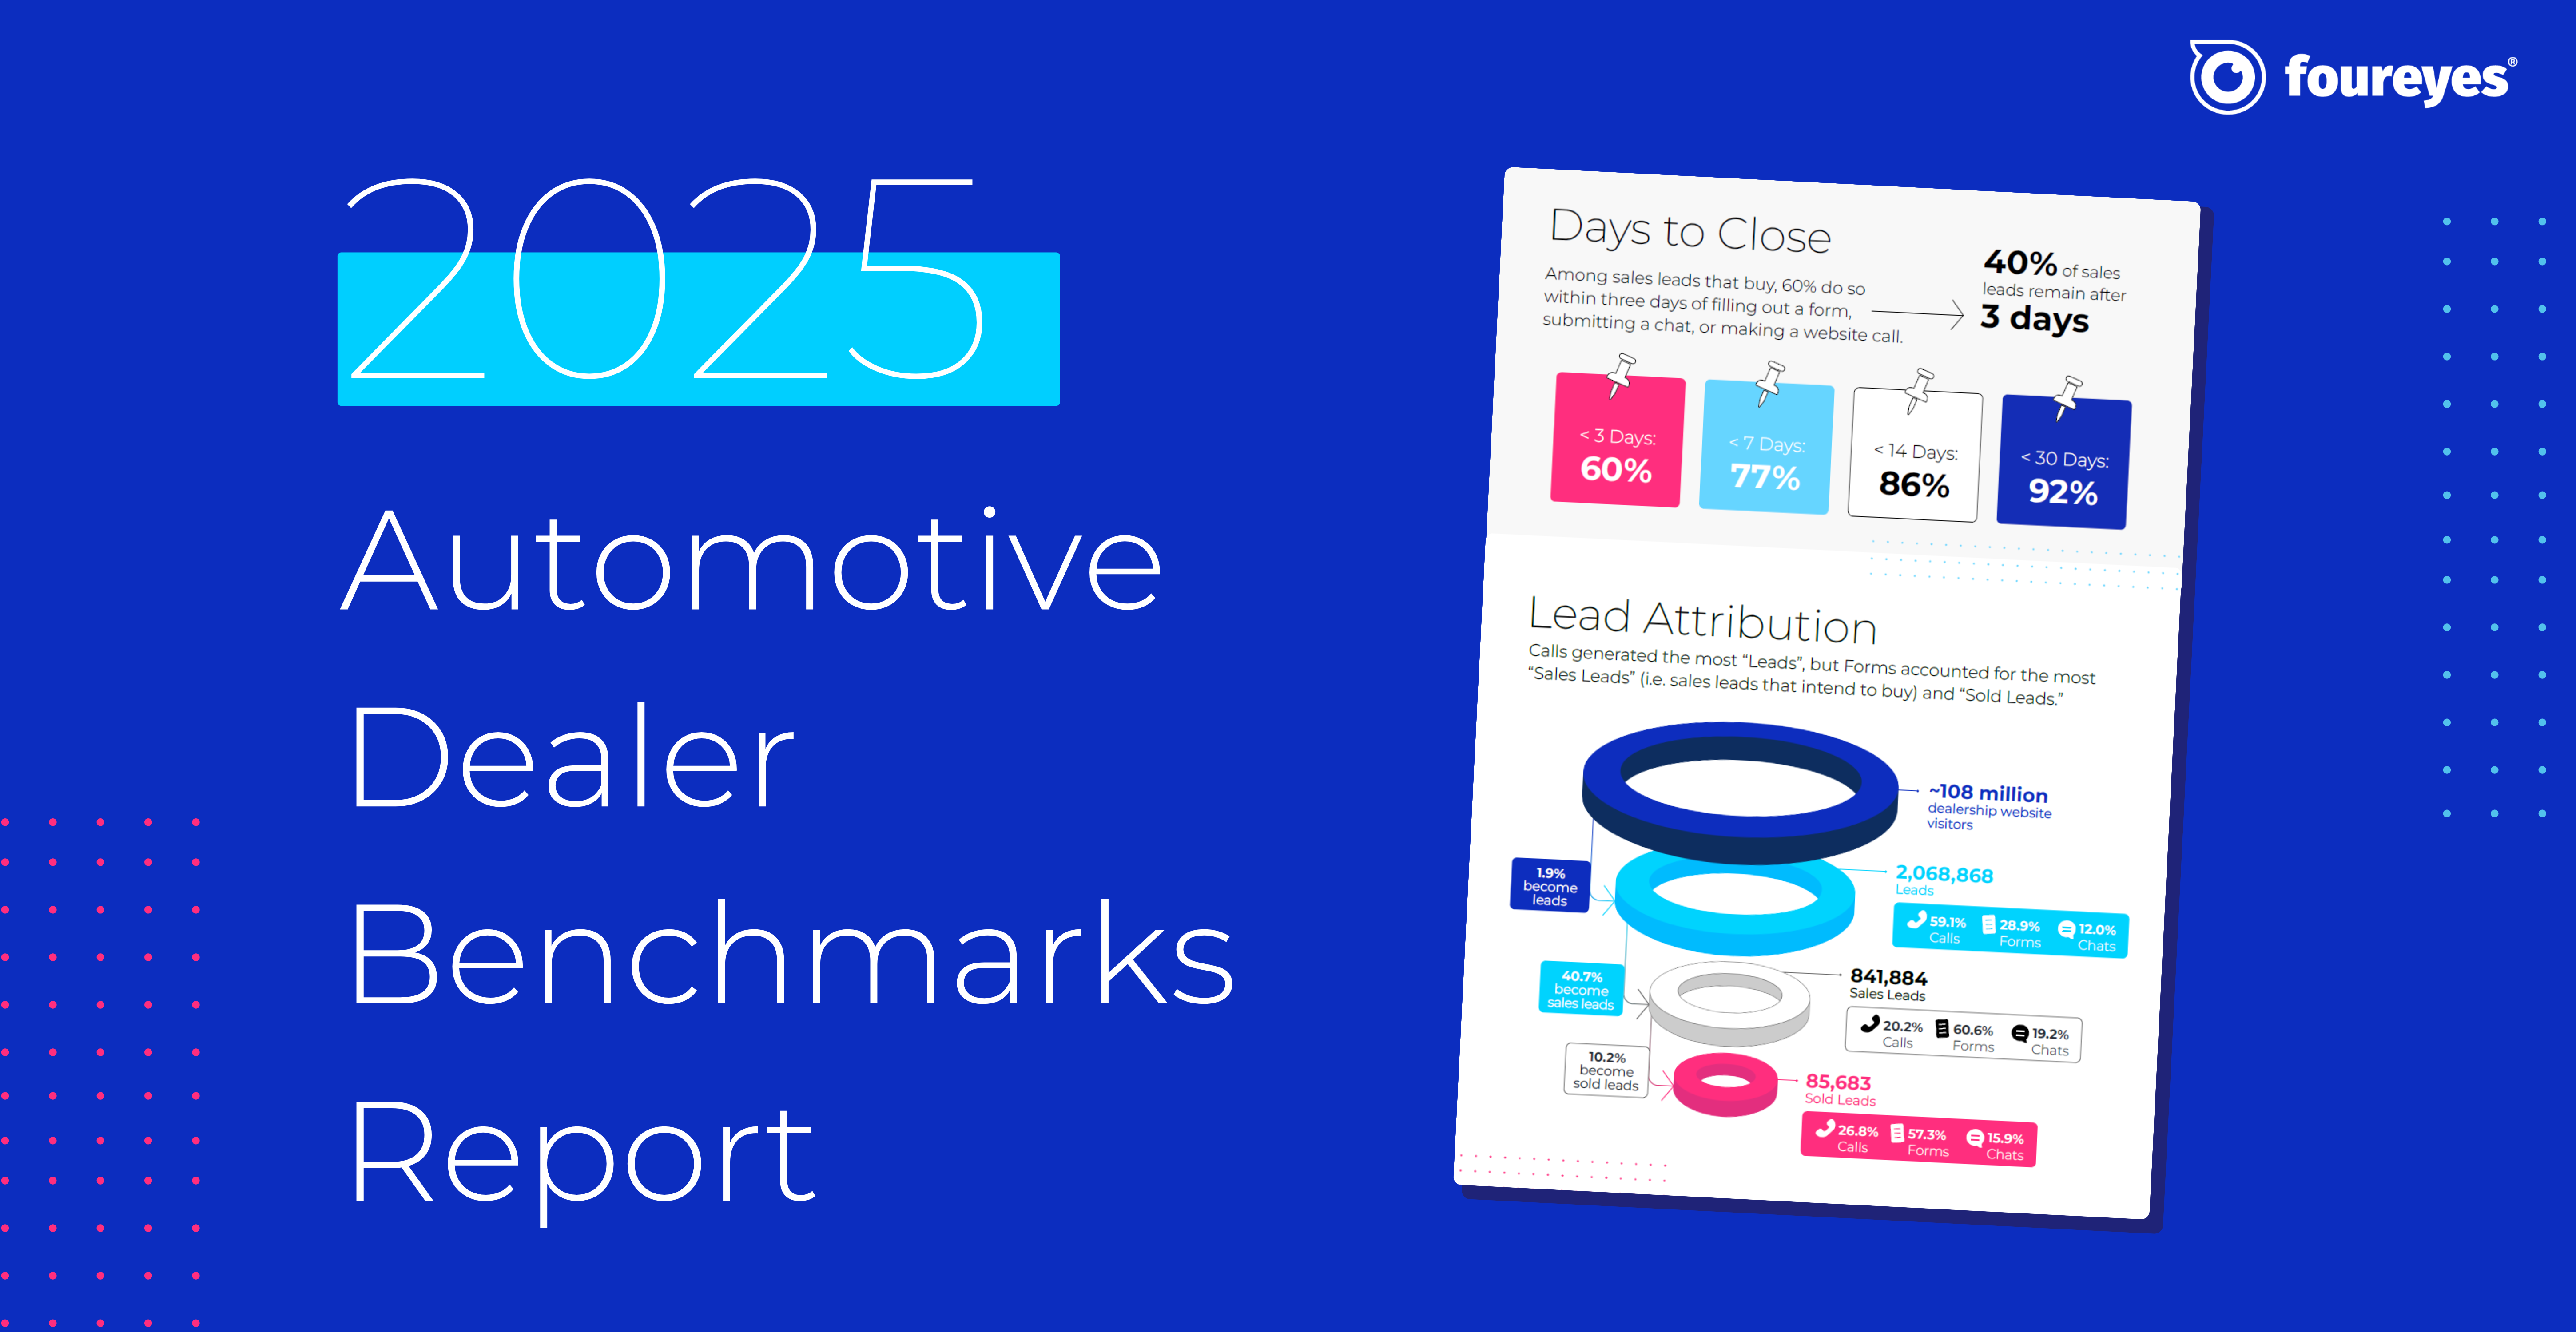 2025 Automotive Dealer Benchmarks Report
For the seventh straight year, Foureyes has dropped its Automotive Dealer Benchmark Report – pulling back the curtain on what's really happening with your leads throughout your sales process.
 Foureyes Changing the Follow-up Game with Inventory-based Texting
See how the latest Foureyes innovation further helps dealerships match prospects to specific inventory.
 There are How Many “Hidden” Sales Leads at Automotive Dealerships?
New research of sales process data across U.S. automotive dealerships sheds light on the opportunity of “hidden” leads in dealership CRMs.
 How many leads do you actually need? And are you efficiently and effectively working them?
Which dials need to be turned, and how far, to ensure they are getting leads for inventory that actually need leads? And to ensure those leads efficiently and effectively worked?

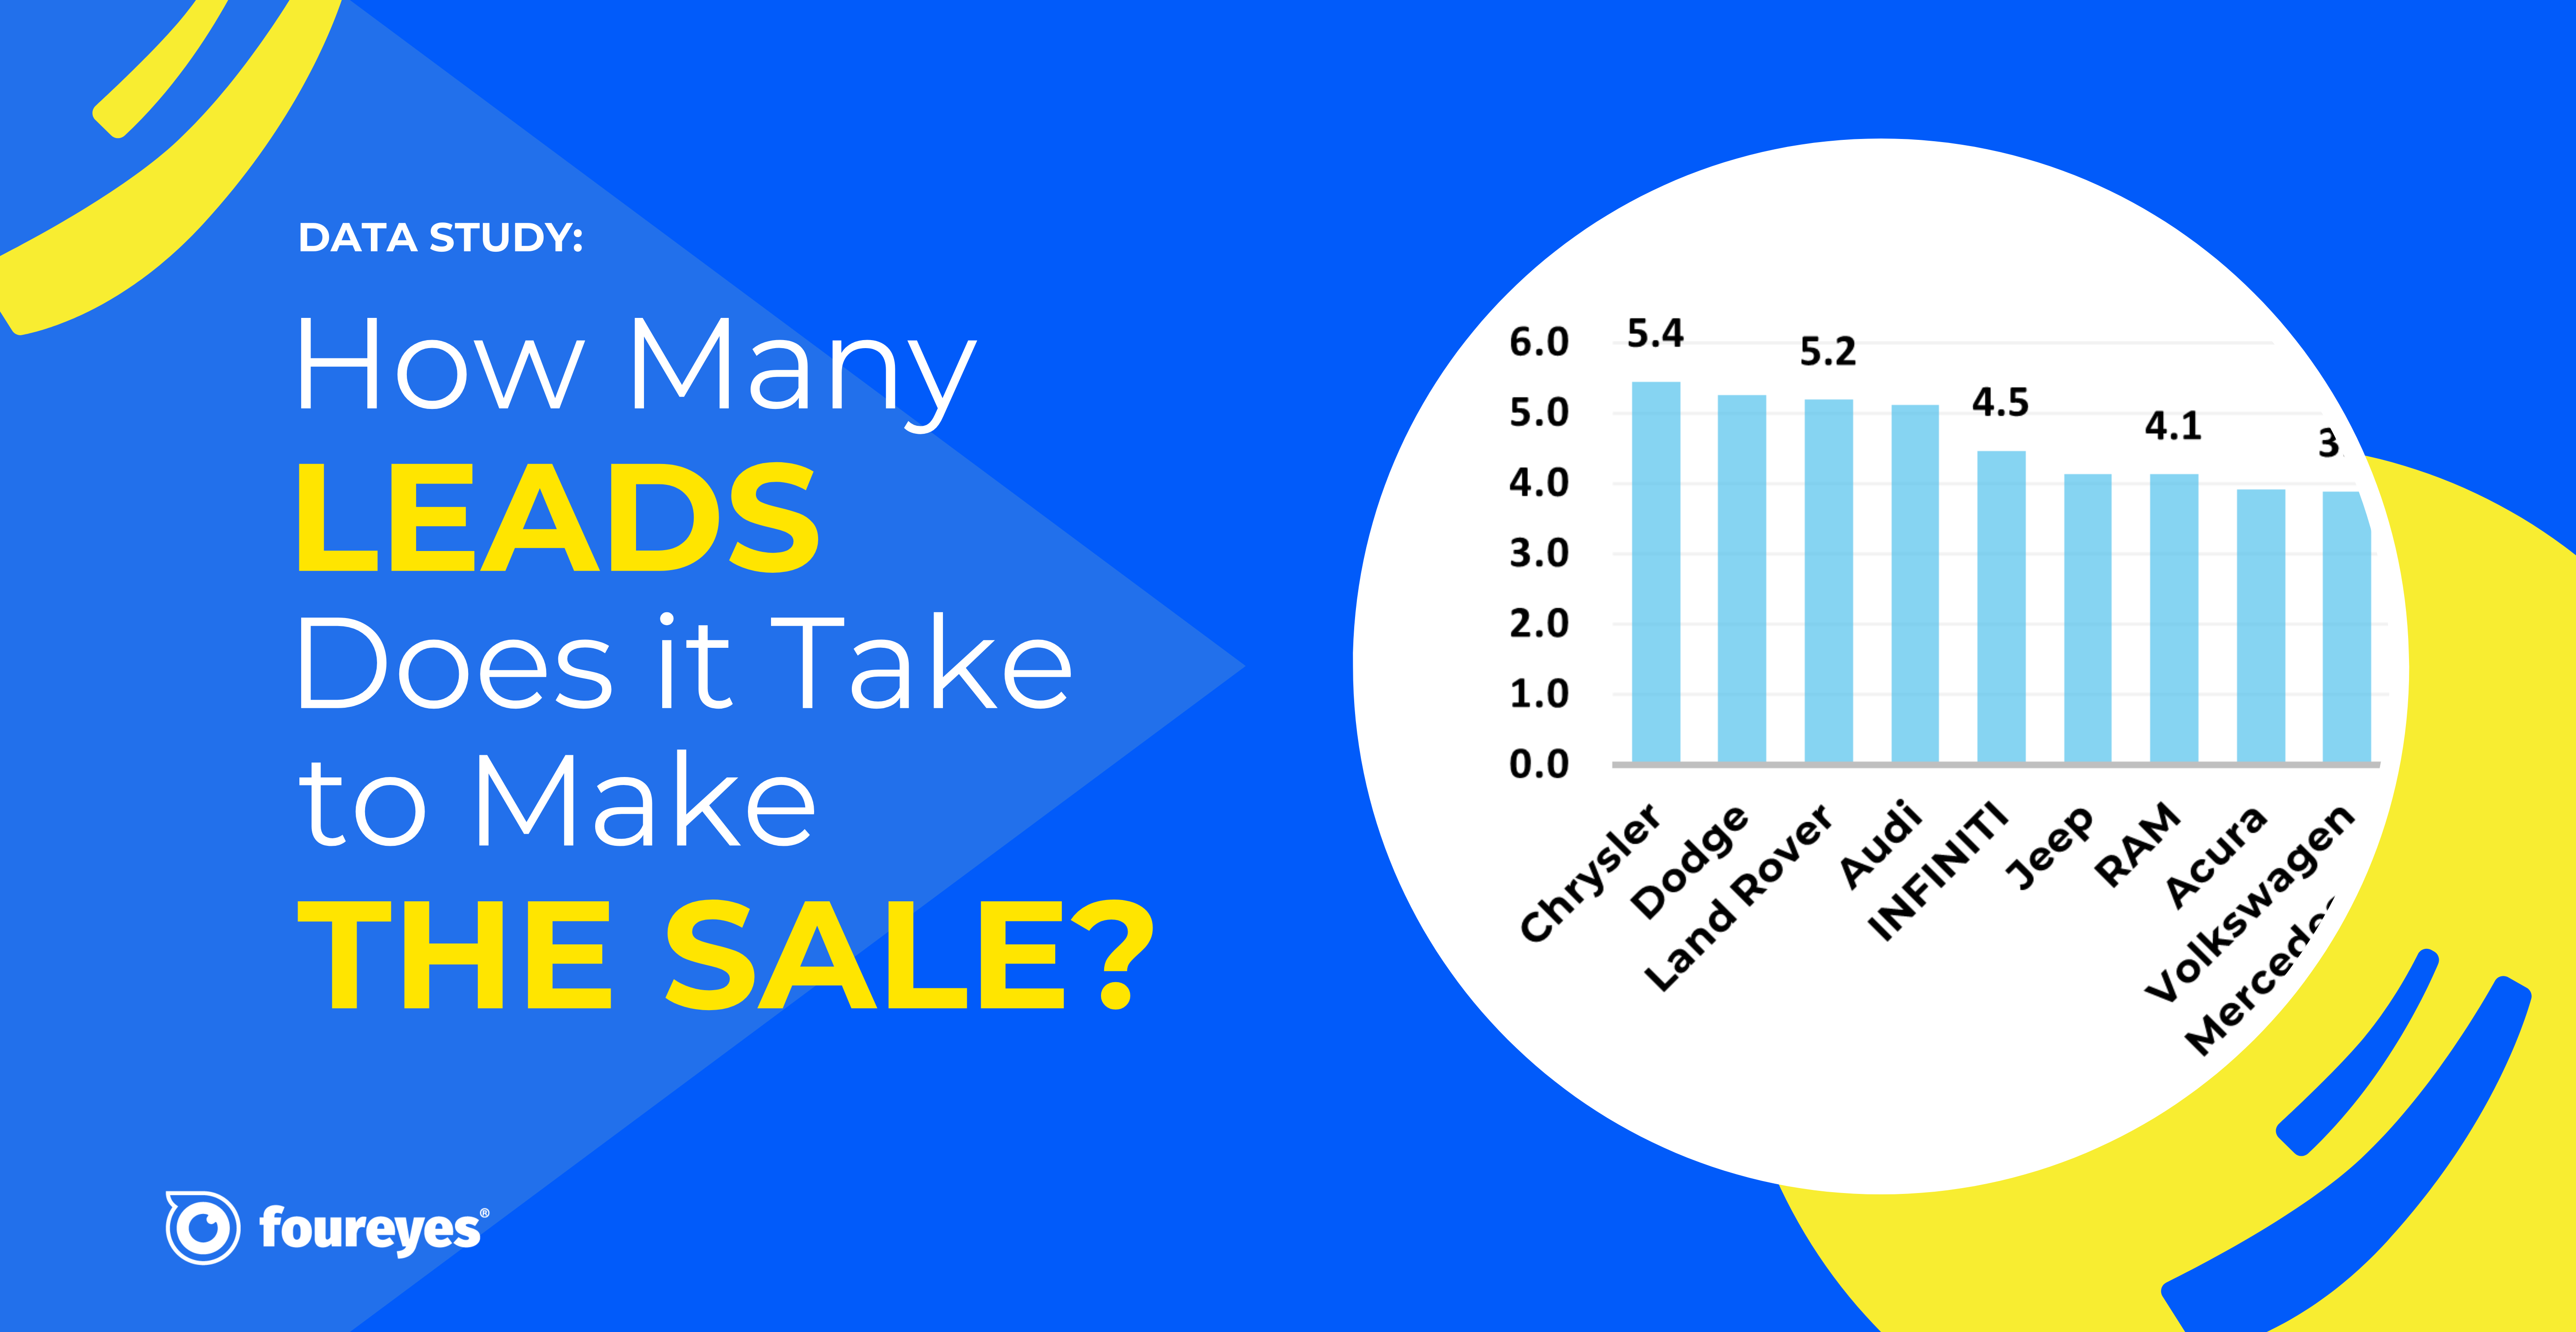 How Many Leads Does it Take for Dealerships to Sell a Car?
A Foureyes study of U.S. automotive dealerships identified the lead-to-sale “efficiency” across new vehicle inventory for Q1 2024.
 2024 Automotive Dealer Benchmarks Report
For the sixth consecutive year, Foureyes released its new automotive industry benchmarks. This data is intended to help dealers and dealer groups compare their performance against the industry and track trends in how leads behave.
.jpg)
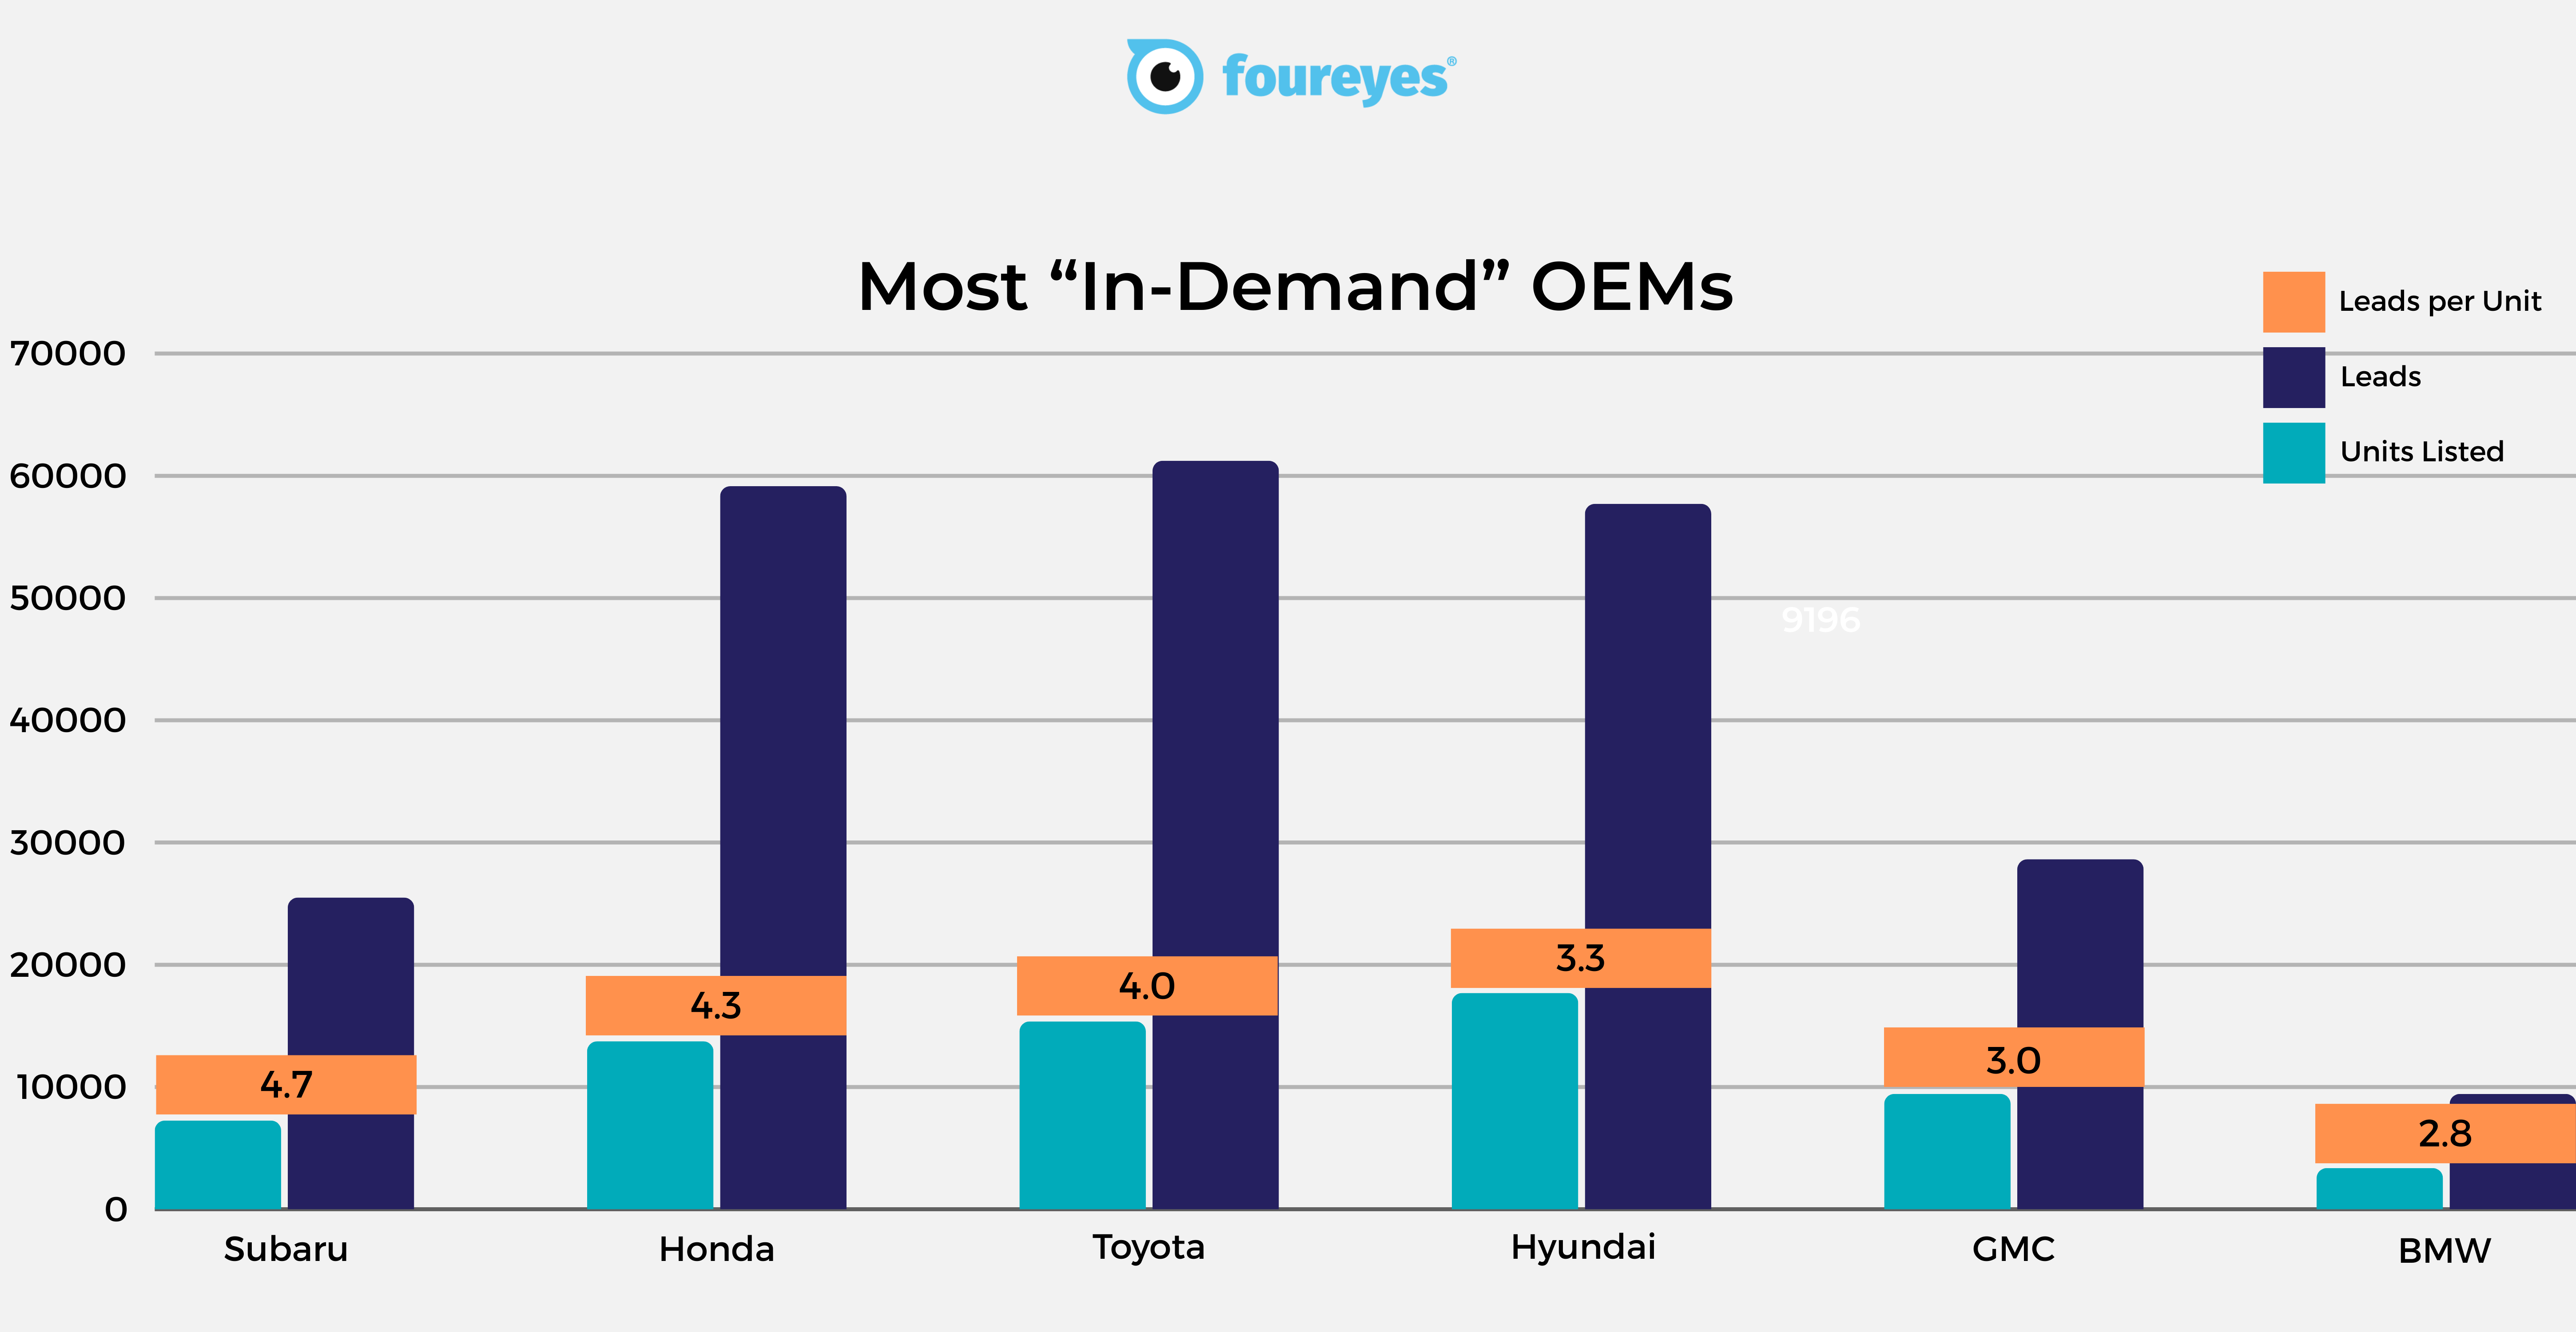 Most In-demand YMMs (2023 & 2024)
We dove into a pool of approximately 700 dealerships to scope out the most sought-after 2023 and 2024 YMMs and their OEMs over the past 3 months (min. 100 units per YMM)

.png)






 2022 Automotive Dealer Benchmarks Report
As automotive dealerships continue to adjust their strategies, tactics, and other process operations during this ongoing vehicle inventory shortage, we at Foureyes are sharing – for the fourth consecutive year – new auto industry benchmarks intended to help dealers understand the market, track trends in how leads behave, and drive sales success in 2022.


 2021 Automotive Dealer Benchmarks Report
For the third year in a row, we’re sharing auto industry benchmarks to help dealers and OEMs understand the market, track changes in customer behavior, and drive sales success in 2021.
 The 2020 Automotive Dealer Benchmarks Report
Start the new year off strong by reviewing your sales performance and creating 2020 goals. See how your dealership stacks up against the competition and use these auto industry benchmarks to develop a marketing and sales strategy for the new year.